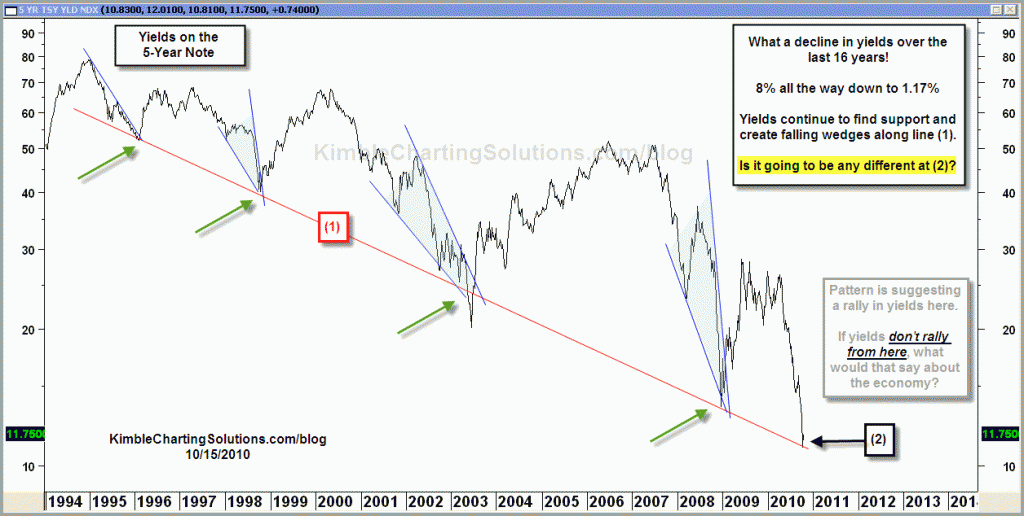
Speaking of trends….No doubt the long-term trend in rates is down. In the chart below, rates have rallied along a falling support line.
Click on chart to enlarge
This long-term yield chart, would suggest to harvest positions, since yields are on support ( prices would be up against resistance).
For those that feel rates could push higher due to this pattern, picking up some TBF (inverse bond etf) would be a good idea, with a 4% stop.


hi!This was a really fabulous subject!
I come from milan, I was fortunate to discover your theme in bing
Also I get a lot in your topic really thank your very much i will come every day
If rates don’t rally from here it would mean the economy is comatose. Anyone interested in a great book comparing the Chinese, Japanese, German and US economies, check out “In the Jaws of the Dragon” by Eamonn Fingleton.
Just read an article in Kiplinger’s. The Federal Reserve will probably start buying $100 billion a month of long term treasuries. They will vote on this at the FOMC meeting on Nov. 2-3. To push down interest rates to spur economic and job growth.
But as Chris says follow the chart patterns not the news.
TBF is for shorting 20+ yr treasury bonds.
PST is double short 7-10 year treasury bonds (no single shorts for these that I know of)
…of course, that website doesn’t have the pretty charts we’re getting used to from Chris and offers no insight but just strips of information on large option trades.
I’m not sure if anyone follows OptionMonster articles, I do because I like to see who is making big block orders in the market on stocks and the VIX. Anyways, an interesting addition to the above post was a large put trade on bond ETFs.
http://www.optionmonster.com/news/article.jsp?page=commentary/in_the_news/treasury_etf_draws_huge_put_trade_49980.html