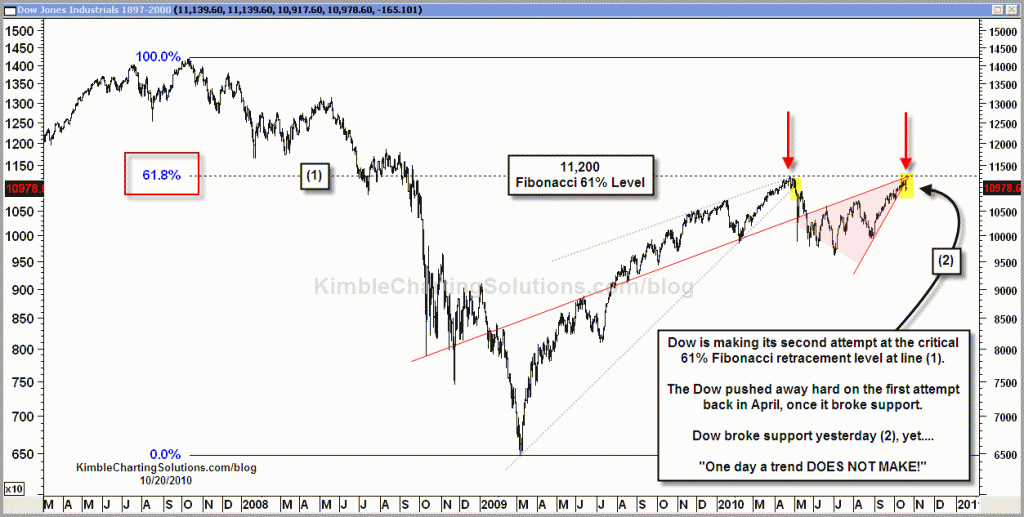
What happened yesterday?
CLICK ON CHART TO ENLARGE
What happened yesterday? NOT A TON….Appears the Dow reacted to the Fibonacci 61% retracement level at the top of the wedge! “One day a TREND DOES NOT MAKE,” yet on a very short-term basis, I do respect that the bottom of the wedge was broken.
The Dow remains at key resistance levels, not only based upon the 2007 highs (hitting the Fibonacci 61% level) the long-term Dow chart above reflects that the 11,000-11,500 range is key resistance as well (see post here for 20/70-year resistance) .
These levels remain a good place to harvest and then see what happens with price action. Should the Dow break resistance I will follow price with a stop!


Blin…Thank you!
In the 70-year chart I highlighted two resistance levels…
11,000–11,500. Agree with you per the range you mentioned.
Attempted to harvest yesterday as tightly into this resistance area as possible.
As we have seen, other areas, especially the international arena has done much better than the Dow or 500 index of late and the past what….10 years?
Chris,
Take a look at the Dow or DIA from 99-02 (best viewed on a monthly chart). Back then it traded in a similar range for about 2.5 years. Therefore if the fibo. level breaks by up to 150 points, they may only be running stops and may take it back to the bottom of the trading range around the 10 000 level.