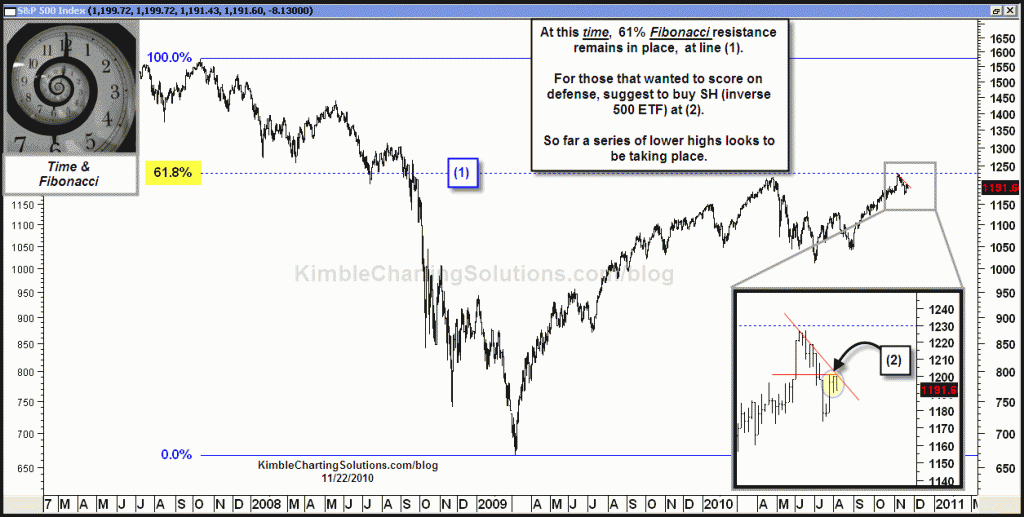
Last Thursday morning, I suggested that aggressive investors could pick up the inverse 500 ETF (SH), due to a key falling resistance line that looked to be taking shape. (see post here)
CLICK ON CHART TO ENLARGE
Game Plan….Was suggested to pick up SH, with a stop at 1,211, which remains in place.


william….you mean turkey week?
DK….Don’t know. Could be down to the bottom of the trading range of this year, which is in line with your number.
James,
Not sure what the upside could be. I attempt to always point out the side that I could be wrong, using a stop. I usually don’t address the upside, I watch the pattern unfold and see where it takes us.
Good job on SH James!
Chris
Looks ok today George?
Hi Chris,
I agree your view that the S&P will not break the 61% Fib resistance as the Hang Seng Index has plunged more than 2 % today. George (HK trader)
Hi Chris,
I follow your advice to short the US market. But buy SQQQ, out of surprise, SQQQ performed poorly, when compared to SH.
Am I in right track, pls. excuse for my ignorance.
Thanks. George.
Chris, you’ve got a great blog here! Really appreciate you posting this great information for those of us who are new to technical analysis.
I picked up a small amount of SH when you posted about it last week. I noted that the trade has a 1% downside, but I’m wondering what the upside potential is? Does it correspond to the lower bound of the S&P 500 falling channel or something else? Your insight on this would be greatly appreciated!
Chris, In your experience with double tops, how far on the retrace would be expected. Is it usually a 50% or all the way back to say 1025?