CLICK ON CHART TO ENLARGE
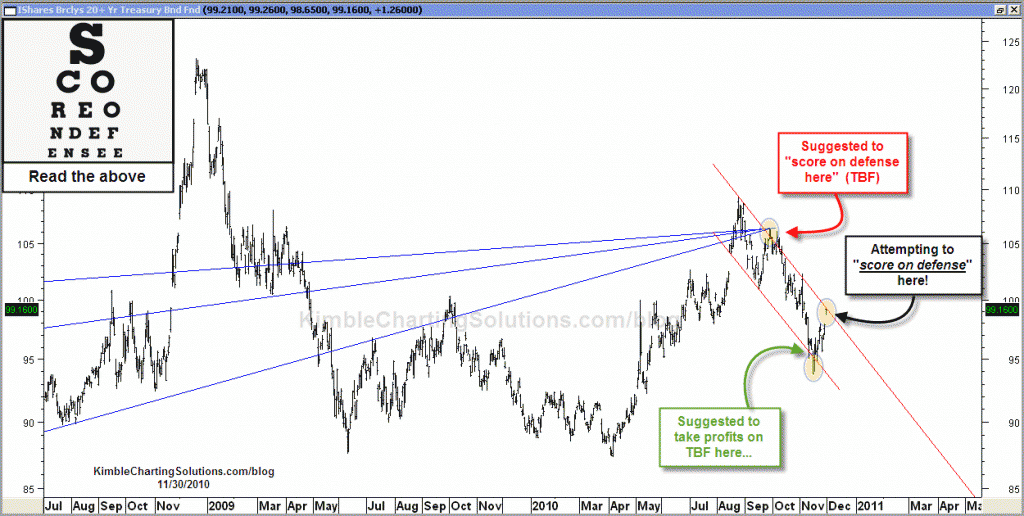
TLT has rallied just short of 5%, from the bottom to the top of the falling channel. TLT is at the top of the falling channel as the Dollar is up against key fibonacci resistance (see post here) and the 500 is on key support, while the VIX is up against resistance (see post here).
Game Plan…Attempt to score on defense, again. Picking up TBF, with a 2% stop.


Thomas….you are welcome! The situation with the dollar resistance and Vix resistance, combined with 500 support, led me to go real tight on the SH stop. Bought SH at 1,199 and still made money on it. Patterns appeared to suggest this rally was coming.
TLT took a real nose dive after hitting resistance yesterday….we were able to pick up TBF a few pennies off the lows yesterday afternoon.
Thanks for sharing and helping me score with TBF, and also with the tight stop I put on my SH.
TA…I bet you did. Great job. Interesting that if you add up the gain in TBF from yesterday and today, the total return is more than the very nice equity rally of today! CNBC just reported that for the first time in months, bond “inflows” were not positive any more!
Mike… For the most part, it seems like volume is low in the after hours trading most of the time. Someone out there might have more to add to that being true or false. Markets during the day can move big, in either direction, without a ton of volume though.
TLT declined almost 1% after the suggestion to score on defense by selling it yesterday afternoon, looks like falling resistance is pretty darn strong!
Chris…I see you were right on the money as TBF is up over 50cents this morning. On my Think or Swim charts, I see that almost all the gain happened overnight and the volume was virtually non-existant during those hours. I noticed that happens a lot on many other issues. I always thought that price movement required lots of volume. Do you have any idea how very, very low volume in the after hours can move stocks so much?
Thanks for the info Chris. Played TBT today. Made some coin 🙂
Mike…Quality tops and bottoms will be at oversold and overbought levels. Patterns help me look for reliable situations. Overbought and oversold can can remain that way for a long time….where do you buy and sell? In a crash, markets are oversold, yet when do you buy? The patterns can really help hit some key points. On the flip side of oversold, markets can be overbought and break resistance and keep on moving higher. Nothing wrong with over bought/sold from my end, just I have found something that I have grown very comfortable with over the past 15 years.
TLT is down almost 1% since the suggested time to “score on defense” will be looking to lower the stop to protect the gain.
Chris…any correlation between your patterns and just watching oversold v. overbought? I notice that on the TBF chart, when full stochastic is below 20 it practically always goes up. I might take a day or two but it just about always happens.