Reason to smile at hand in the coal industry???
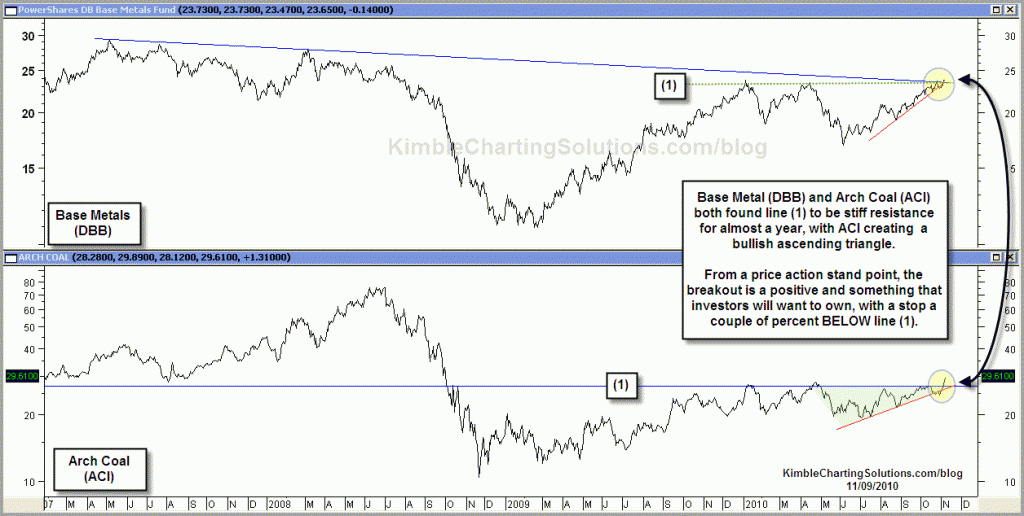
Base Metals ETF (DBB) and Arch Coal (ACI) have been held back by resistance for most of this past year. After multiple attempts, both are pushing above key resistance in the chart below.
CLICK ON CHART TO ENLARGE
Investors will want to own these breakouts with support line (1) as the stop. If we get some gains established the stop will be changed to a trailing stop.
CLICK ON CHART TO ENLARGE
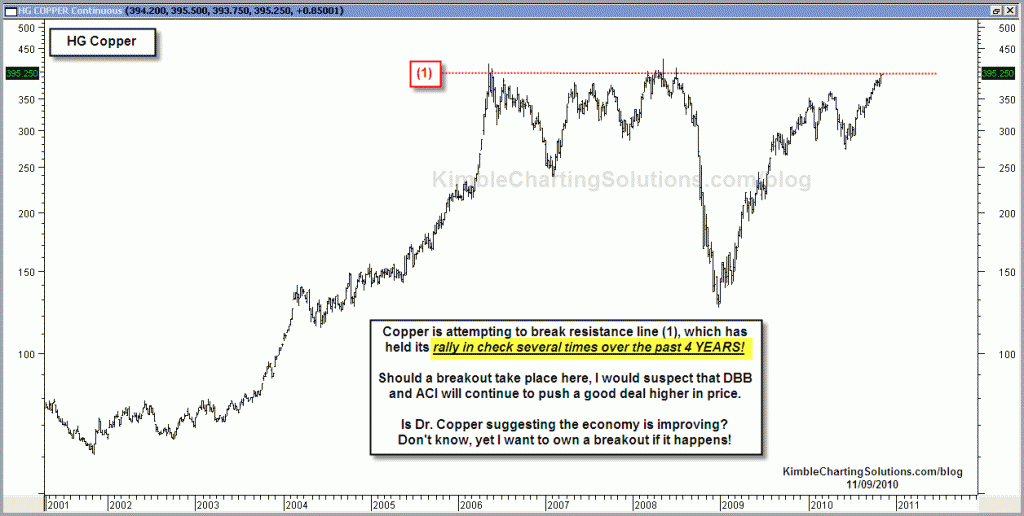
Big resistance test is at hand for Copper right now, as it has run out of gas numerous times at line (1) over the past 4 YEARS! Should Copper break through resistance, odds would favor a pretty good rally since it has been held back by resistance, for such a long period of time.


nothing wrong with that quality idea Sir Doug!!! Missed picking up TBF by a few pennies yesterday afternoon…will see where we go from here!
Buy base metals, as dollar’s on resistance. buy stop above the highs…
great suggestion and good eyes…. on the bond play today. simply buying on support… no TS suggstion?
Doug,
I feel currencies are very important for sure, yet I like to look at each asset as its own case.
Earlier this year, the dollar and gold were doing what from January to June? Would you believe they up over 10%, at the SAME TIME!?!?!? Check out the price action of UUP and GLD from January to June.
CRB (commodity research bureau) index has traded between 200 as a low and 280 as a high for the majority of the past 30-years. CRB broke 280 a short time ago and has rallied up another 10% plus on the breakout. Was this because of Ben back in 2004?
Well it broke the same 280 level back in 2004 and went all the way up to 500. This was a big-time rally in the CRB to say the least. Was that due to QE1.0?
Why the CRB rose almost 100% is above my understanding, per why, yet from a pattern perspective, I was comfortable following it then and I feel the same now.
Even looking in the “Rear View Mirror” do we ever now why something happened?
Yesterday I ran the post per “FEAR the LACK OF FEAR” in the NDX 100/VXN. An example of overlooking QE2 and attempting to deal with the patterns at hand.
Chris do these charts suggest the dollar is going to break its long term support? Fundamentals like Helicopter Ben’s QE2 – Do you look at it and conclude that it raises the probability the dollar breaks support, so commodities up, stocks up? So what I’m asking is I know you preach the power of the pattern, but do fundamentals cause you to think it’s probably going to play out this way at an inflection point?