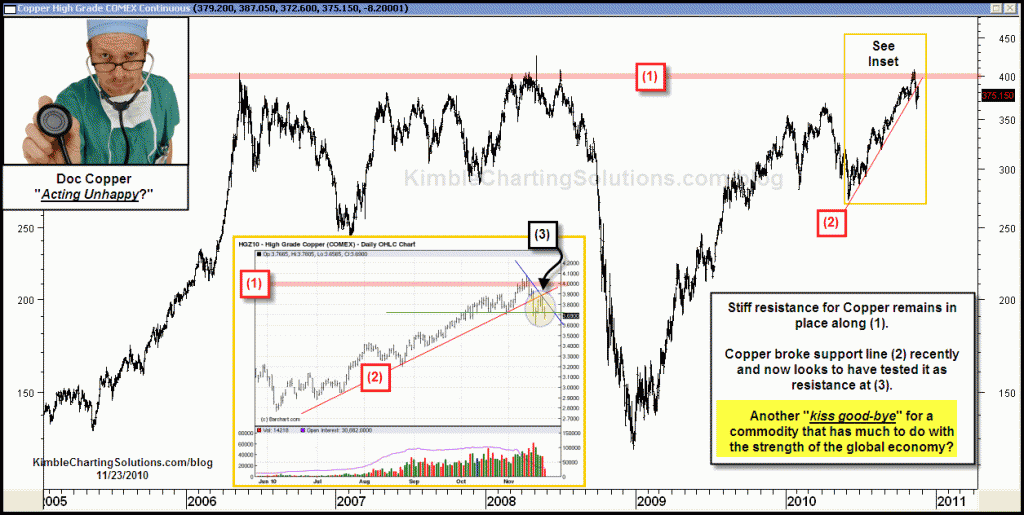
Yesterday I shared that Crude Oil looked to be testing the underside of resistance and often this is a “kiss good-bye” on the way to MUCH LOWER PRICES (See post here) Is the same thing happening in Copper? See below-
CLICK ON CHART TO ENLARGE
Copper has much to do and say per the direction of the global economy. Watch Copper and Crude oil as a sign for overall direction of the economy going forward.
On a side note, anyone surprised that Crude Oil is down with the news coming out of Korea this morning? Does this reflect just how soft Crude could get? For those long commodities, this is a sign to be cautious!!!


Hi Chris,
Really like the inset graphs to show the shorter-term picture and volume is also useful.
Thanks,
cK