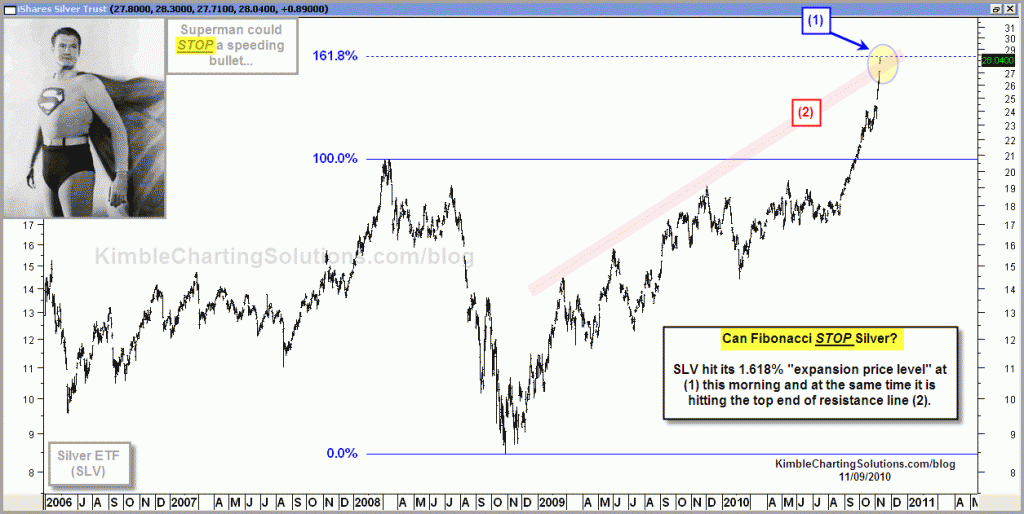
Yesterday afternoon I did the chart below (see post here) reflecting that the Silver ETF (SLV) was HITTING KEY FIBONACCI resistance. The post was made about 30 minutes before SLV hit its high and created one heck of a “huge upside (bearish) wicks!”
CLICK ON CHART TO ENLARGE
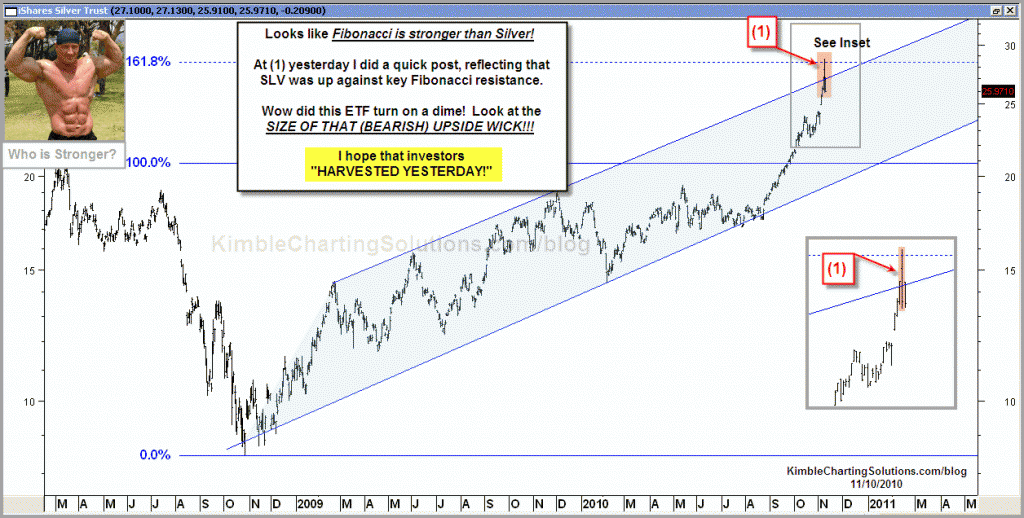
Below is an update to the chart above….WOW what a difference a day can make, when an asset hits Fibonacci in a fast moving market.
CLICK ON CHART TO ENLARGE
The action of late had to suck a bundle of investors into this market, that I suspect are doing a ton of second guessing right now! Emotionally it is hard, yet it often pays off to “Harvest at resistance and Buy on support!”
Congrats to all of you, that on your own, saw the chart and bought ZSL (inverse Silver ETF) yesterday at the time of the post.


