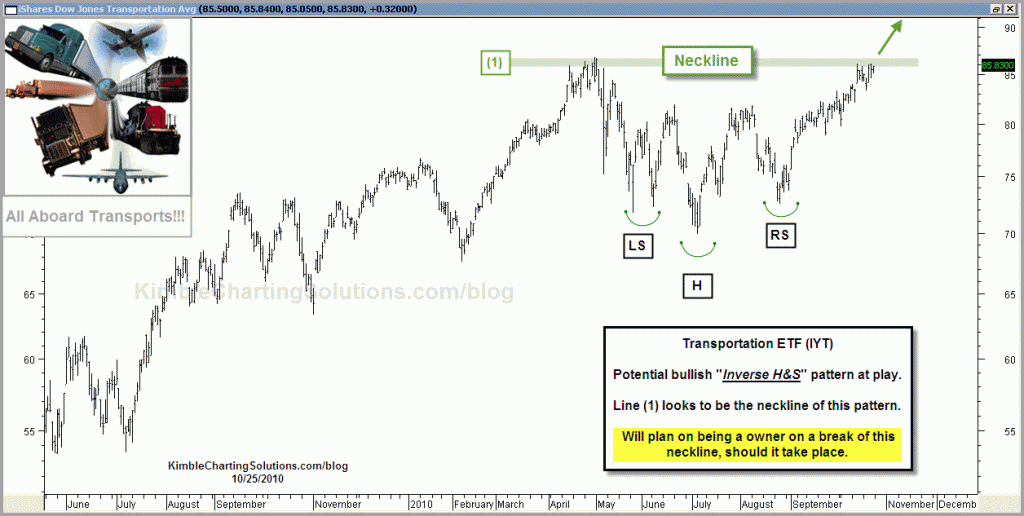
Shared in the chart below that the Transports looked to have created a “Bullish Head & Shoulders” pattern and that I would want to be a buyer on a neckline breakout (see post here).
CLICK ON CHART TO ENLARGE
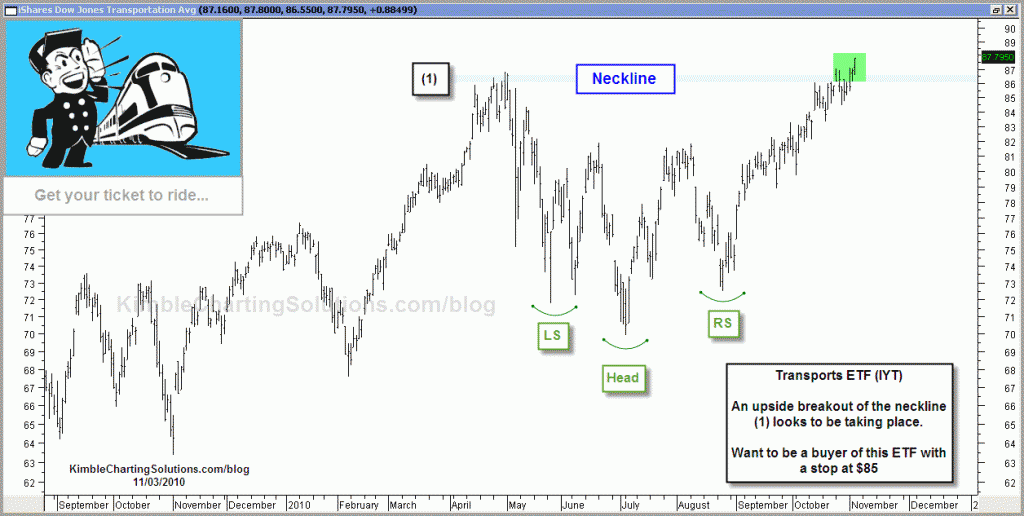
Updated chart below…
CLICK ON CHART TO ENLARGE
Game Plan….Be a buyer of IYT/Transports with a stop at $85 due to a breakout of line (1).
Railroads and Trucking “ascending triangle breakouts” already have taken place (see post here). In that post I shared that the positive action of Railroads, Trucking and High yields, made the markets look vulnerable to upside breakouts.
Some might wonder why I would suggest say Chile (see new purchase here) over Emerging markets or Transports over say the broad market. Nothing wrong with Emerging or the Broad markets…I am just looking for “relative strength/out performance.” Nothing more than that…. please see “Does searching for relative strength pay off” for more on this subject. (see post here)


ck…
The ole saying goes something like “beauty is in the eye of the beholder” also can apply to patterns…in that patterns can be viewed in several ways. In my opinion this is an art, not a science.
RPG shared that this might not be an ideal H&S or even an H&S pattern. He could be 100% right. My point was, IYT was breaking resistance. I wanted it and that resistance, which is not support will be my new line in the sand protection wise.
As I have shared before and will continue to do so…I don’t care about being right, I just want to make money.
Hi Chris,
So just to clarify, the resistance line on te chart is still a resistance line even if the underlying pattern is not an inverse H&S?
Thanks,
cK
RPG….Agree that it may not be an ideal H&S pattern or one at all!
As I shared in the post, The key is this…I want to buy the breakout of resistance.
Thanks for the comment.
Neckline isn’t touching head and should. Not a true H&S IMO.