CLICK ON CHART TO ENLARGE
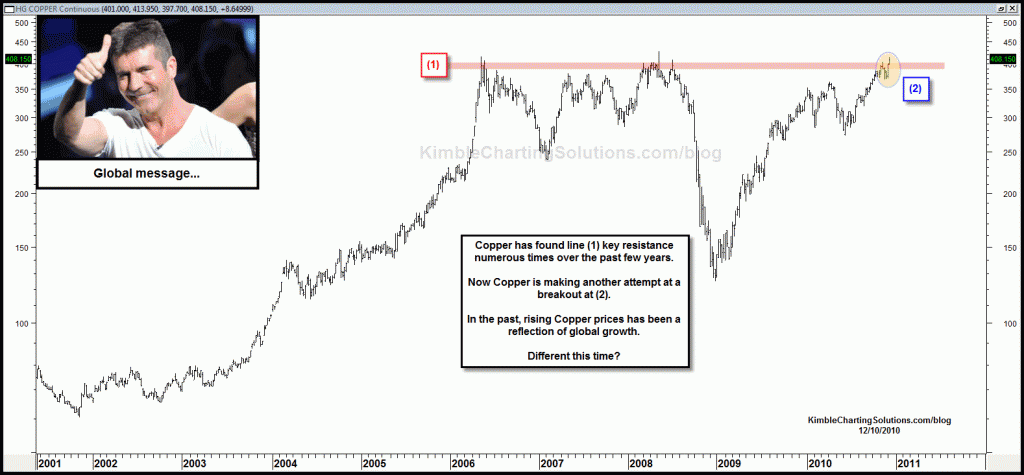
In the past, Copper moving higher, has not been a bad sign for the global economy. For the past FOUR YEARS, Copper has found line (1) to be key resistance. A breakout in Copper at (2) in the chart above, should be a good sign per global growth.


Greg…several upside wicks at the 4-year resistance line in Copper. It needs to move higher and stay to really set itself apart from this key line in the sand. Most likely will get tricky up here, just like it has been many other times.
@b see the rising trend line that was broken at a high price level in 2008?
Chris – great blog. I love it. So simple yet effective. Market objectivity at its finest.
Per this post – I would agree with the mechanics of the trade set up, but would have to agree with Tiho on the metal’s relevancy to econ growth at large and the broader markets. See the bubble in the asset in 2008 as the world was on the precipice.
Copper is not a global barometer story. This is total nonsense. China buys copper and iron ore to feed the massive credit monster. They keep building and building and building…. and building and building and building…. and building and building… which accounts for 60% of its GDP. They are addicted to property development.
And all the buildings are empty. None of the buildings earn income to pay back the debt these developers borrowed. Don’t think for a second that the rise in Copper is a sign of a healthy global recovery, because when that excessive credit driven bubble in China pops, we will see what happens to Copper prices.
And remember that their M2 has grown over 55% in the last two years and their credit lending this year was bigger than the US even though they are much smaller economy. Either 3 months from now or 12 months from now, Copper will be trading at $1.00 again!
Now for a short term trader, go ahead and promote the pattern of a break out, that is fair enough.