CLICK ON CHART TO ENLARGE
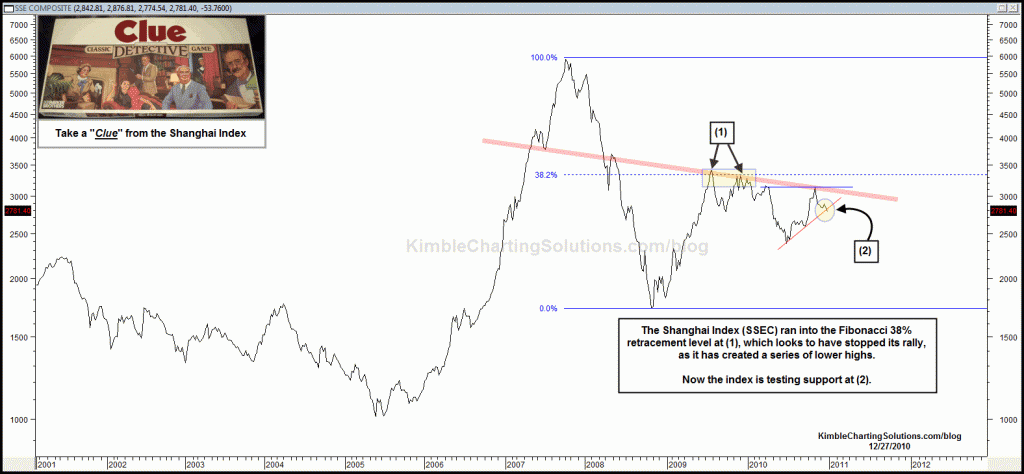
Last week in the post “Cracks in the Great Wall” (see post here) I highlighted that the China ETF (FXI) was breaking support. Now the Shanghai index looks to be attempting to break key support at (2) in the chart above. Is the price action in China a “Clue” to what could take place around the globe? So far the downside action in China has been small. If the support break picks up speed, watch for ripple effects in Europe and the United States.


pH…see update on the shanghai index. It is now within 3% of the top of the flag.
Hey Chris – How about a Chinese topping date on this coming Monday, at that bold resistance line on this chart.