CLICK ON CHART TO ENLARGE
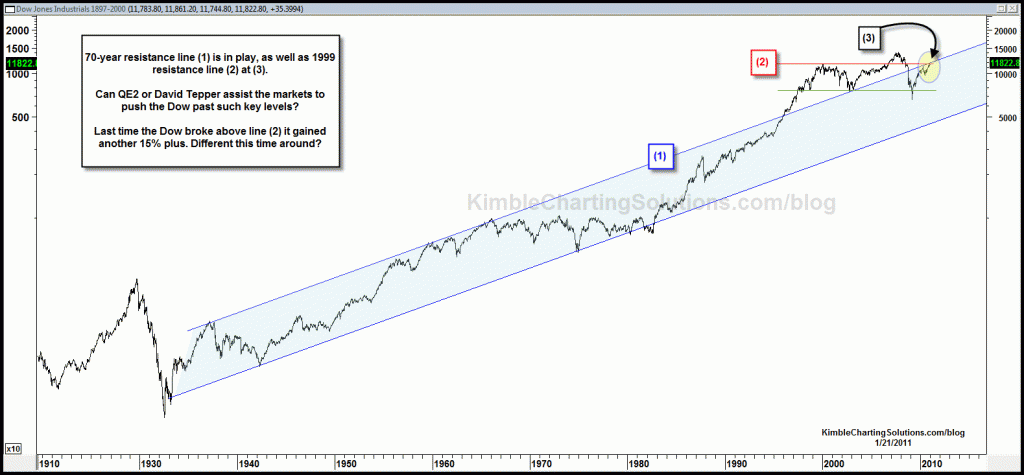
Not only is 70-year channel resistance at hand, resistance based upon the 1999 high is at hand, at the same price point at (3). Resistance is resistance until broken in this long-term chart. The last time the Dow broke line (2) it pushed another 15%+ higher. Going to be different this time?


