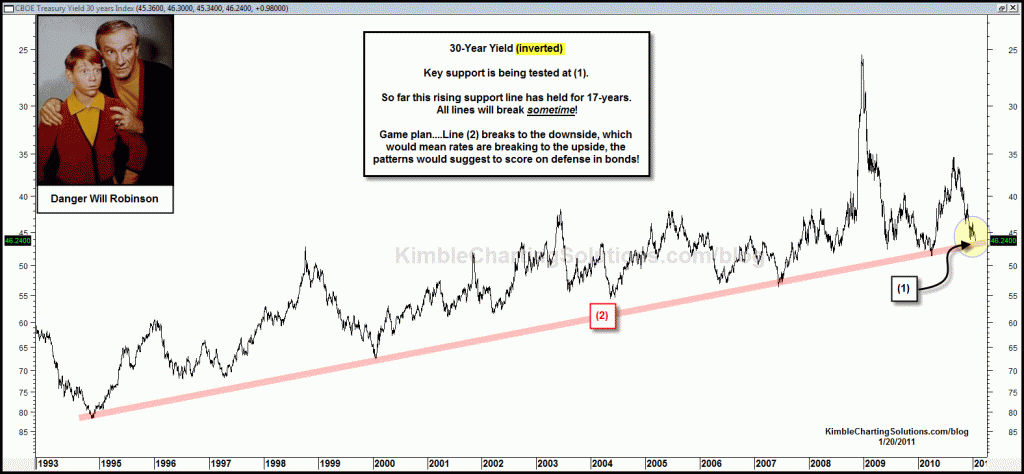
This chart below appeared on dshort and Business insider yesterday. 17-year support line in play per the long bond!
CLICK ON CHART TO ENLARGE
Below is a close up view of the 20-year bond etf (TLT)
CLICK ON CHART TO ENLARGE
Breakdowns in Basic Materials, Transports and the Russell (see post) and the 30-year bond yield is on 17-year support and TLT is at the bottom of a channel, creating a potential double bottom.
Hmmm….wonder what we should do with bonds due to this situation??? Chart directly above with a tight stop is more than a clue! For sure it won’t take long for this bond situation to resolve itself!!!


Chris, TLT seems to have absolutely broken its support line, now at 89,85$. Is this the moment to sell? I still like your contrarian thesis, and if stock markets sell off, bonds could maybe surge, but then again, maybe not….
Sam… Good observation and I will do that within the next 24 hours.
Today we have reached the test of this trendline. Chris, could you do a chart for the 10 yr yield index as well just like this one ? I think the combination of these two charts would be a powerful indicator of bond direction this year (and indirectly the stock market movement). Thank you.
Jon…Thank you. Yields did fall and bond prices moved higher yesterday. I like the one day move, yet need more to go to prove anything.
Good call, seems like it broke that support today. Keep up the awesome work!
First chart reflects that Yields are on a decade plus SUPPORT LINE on this “inverted chart” which means bond prices are on “long-term” support, that has held numerous times. The TLT chart also shows that bond prices are on support. This is an ideal time to pick up some bonds with a stop. Should the 15-year yield line break, which would mean bond yields are breaking to the upside, investors would not only want to sell the longs, they would want to look to score on defense.
Chris,
Am confused (and/or dumb…pick your choice):
First choice (if support broken) means yields are going up, which means bonds go down. But, in the second chart, both falling pattern & double bottom indicate bonds ago up. I am officially confused by your “score on defense” phrase….I am guessing you mean if/when we have a bump in TLT, you are suggesting folks sell but your long-term forecast is still bearish (based on first chart)