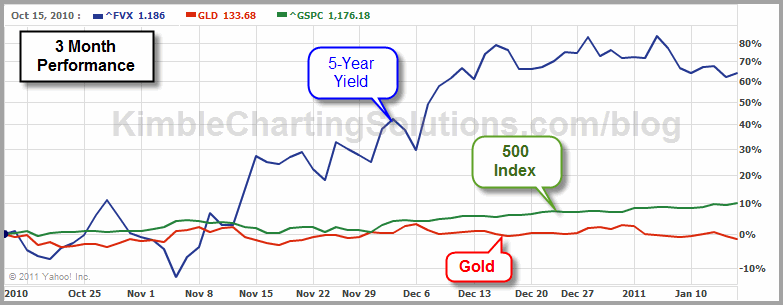
If stocks were up over 60% in the last 90 days, would you consider that they might be due a rest? Below is a 90-day comparision of the 500 index, gold and the yield on the 5-year note.
CLICK ON CHART TO ENLARGE
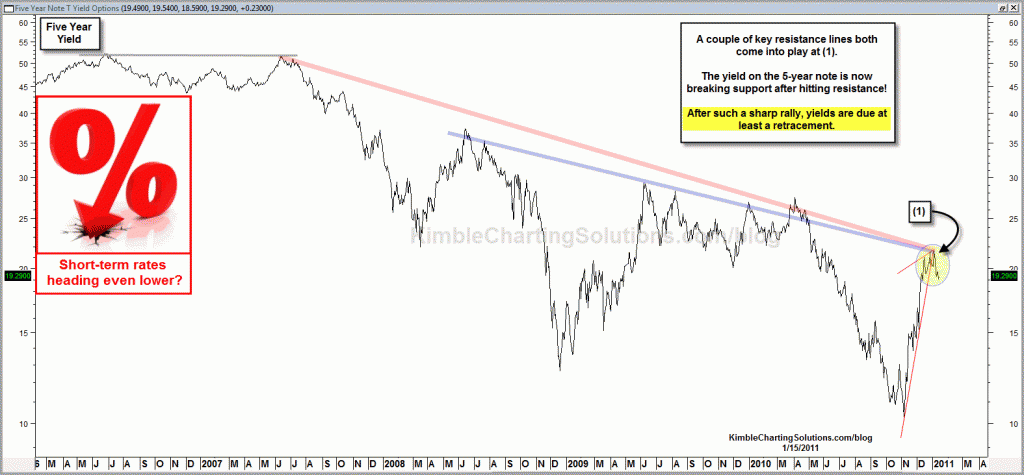
See below for a multi-year chart on the yield of the 5-year note.
CLICK ON CHART TO ENLARGE
The yield on the 5-year note, after hitting multi-year falling resistance, looks to be breaking support at (1) in the above chart. After a 60%+ rally in yields over the last 90 days, the patterns look to be suggesting that short-term rates should be heading lower for a while.


Sam….Thanks for the info on the etf’s.
I did a search for LQD and found this post from last week
https://www.kimblechartingsolutions.com/2011/01/boring-update-investment-grade-bond-lqd/
IEI, which is the 3-7yr fund is not thinly traded. Relatively the others mentioned have low volume. IEF, which is 7-10 yr ishares fund has good volume. The percentage gains of these over the last 1 month have been lower than LQD which is investment grade corporate bonds. So, on a relative strongth basis, LQD would be a good pick, if we are going to play the rise in bonds (or you could use this as primitive hedge for your stocks).
BTW, i noticed that for more than a month, the search box is not working on the site. I am using Windows 7 professional edition on a brand new PC, so i dont think it could be an issue with my explorer. The search feature works in my firefox. Anyone else notice this ?
actually i mixed those up – FIVZ is Pimco and IEI is ishares, and PIVZ is thinly traded. Need another cup of coffee I guess. Both may have bounced off rising support dating back 4-5 years.
FIVZ (ishares Barclays 3-7 year treasury bond etf) and IEI (Pimco 3-7 year US Treasury index fund)are possibilities. The latter is very thinly traded though.
Belsha….A couple of weeks ago I did the quiz, per the etf TIP was on support, similiar to the 17-year falling channel yield resistance line. Per playing the shorter term bonds, one could consider IEF, which is the 7-10 year bond. At the moment a 5-year bond etf doesn’t jump out at me, yet I wouldn’t be suprised if their is one. Any readers have a suggestion?
Chris, what ETF to play the possible raise in 5 years price? I’m still long TLT on your advice, but haven’t seen any action yet. I still like your general (contrarian thesis), that’s why I’m keeping it!