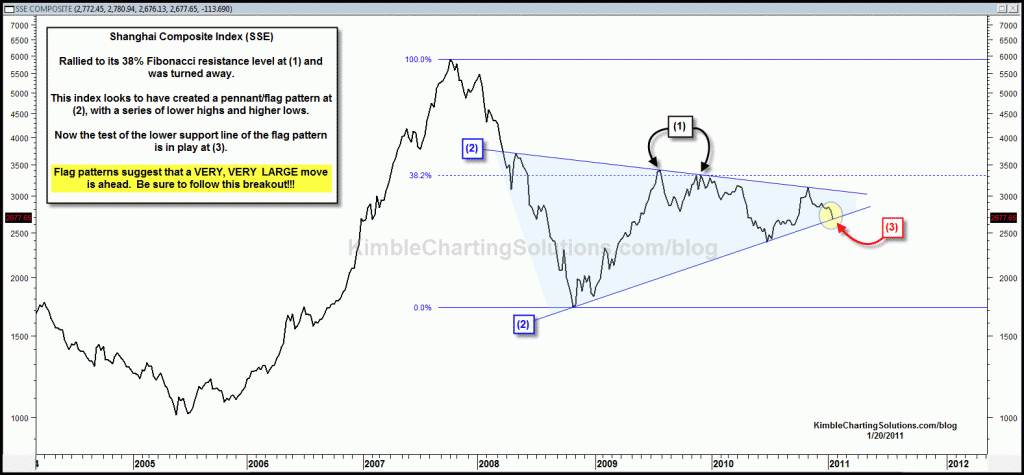
I produced the chart below for Doug Short yesterday and sent it to him before the market opened, which he posted last night (see post here)
CLICK ON CHART TO ENLARGE
What this index does can influence many markets around the world. Support is support until broken. Right now at (3) this key global index finds itself on support! This flag pattern suggests big opportunities are ahead for this index, since flag patterns the majority of the time suggest a huge move is in the making!


Wanda….Shangai is about 1% below the top of the flag resistance line right now.
Hey Chris, looks like we are right on the brink of a breakout. I can’t seem to find the chart to check it out but I have been keeping up with it. Can you update the chart and give your thoughts on it. Thank you.
Wanda…I am not thinking that I know the direction on this flag pattern. Flag usually lead to a huge breakout/breakdown, which I will follow. Some decent signs for the upside is some decent action in some of the BRIC’s of late. I will just follow.
If Copper/FCX/IYM is suggesting anything….global softness is starting to take place.
Well Chris…..it’s close to the top of the triangle. Any new thoughts on the direction. Still thinking down?
Wanda…flag is still in place, meaning the index remains inside of the pattern, as the flag pattern get closer to ending by the day. If yesterdays EEM/EFA post means anything, it would suggest the flag breaks to the downside.
Hey Chris, just wondered if you had any more information or ideas about the direction of the triangle. Any new thoughts to share with us?
Sir Chris:
Since the pennant flag pattern has broken to the downside on that $330+ stock, would we expect a sizeable downside move? I won’t mention the name of the stock as I don’t want you to end up in a barrel.
Your pal,
Jon
Mark…Couple of potentials that I plan on using are FXI and FXP. They don’t track the Shanghai exactly, yet if a big move does take place, these should allow us to ride the breakout.
JB…See the ETFs you mention and FXI compared to the Shanghai index. Performance varies.
http://finance.yahoo.com/echarts?s=000001.SS+Interactive#chart4:symbol=000001.ss;range=2y;compare=gxc+caf+fxi;indicator=volume;charttype=line;crosshair=on;ohlcvalues=0;logscale=on;source=undefined
Wanda…Some of the viewers would be a better source for this answer than I. Any thoughts anyone?
What is the best vehicle to trade this idea? GXC? CAF?
Chris, if China revalues their currency higher wouldn’t that make their market go down as when the dollar goes up in US the market goes down here?
What bull or bear etf’s should we use on a breakup/down?
Currently support is support. The index rallied over 1% off this line today. I have found that flags don’t seem to tip the hand per the direction, yet the majority of the time a huge move follow the completion of the pattern, since both bulls and bears get very frustrated towards the end of the flag/pennant. I love this due to the amount of price action that usually takes place upon the breakout/breakdown! It will be worth the wait and mostly likely be very rewarding!
so which direction? I don’t know, yet I for sure will follow what usually is a big move!
Chris,
In your note to Doug, you just mention of a big move but you did not imply in what direction? Is my interpretation accurate? By conventional thinking, wouldn’t one assume that the big move is going to go down, as pennant formations usual tend to go in the direction prior to the formation of the pennant? Clarifications much appreciated. As always, excellent work.