CLICK ON CHART TO ENLARGE
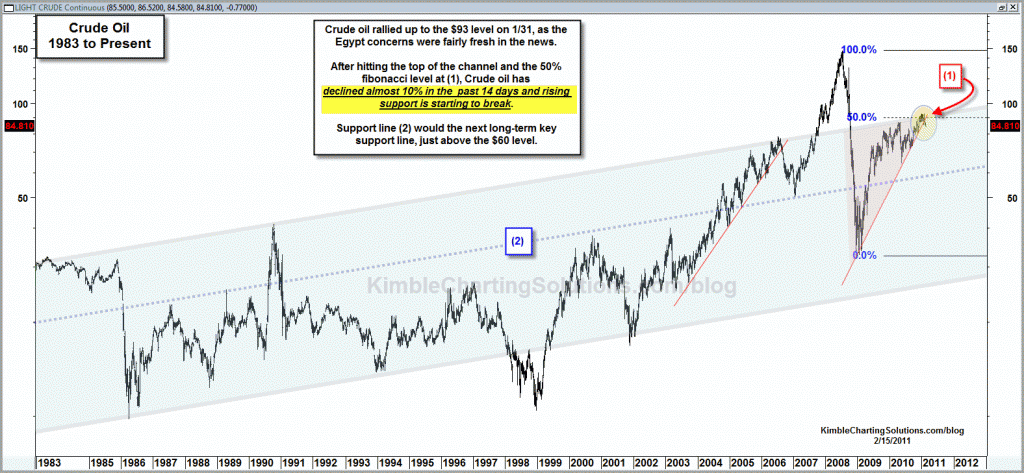
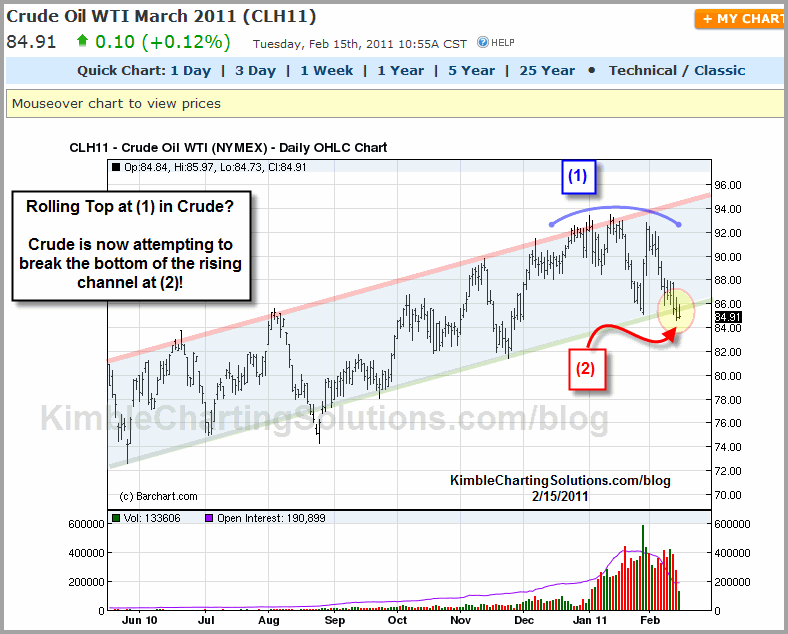
Rising channel resistance dating back to the early 1980’s and fibonacci resistance both came into play at (1), about the time the news from Egypt took center stage. Crude oil has decline almost 10% in the past 14 days, even while mideast concerns are front page! Not only is long-term resistance at hand, check out the situation below, per the 9 month long rising channel…
CLICK ON CHART TO ENLARGE
Channel support in the chart above, looks to be having trouble. In the top chart, mid-range channel support comes into play around $60. A true break of support at (1) in the top chart would suggest plenty of room to score on defense in Crude oil!


Gary…The April Crude futures contract is trading around $98 this evening…6:30 central. Will see if the oil stocks position we own (OIH/IEX) pays off tomorrow. The Dow is off around 90 points tonight.
crude has made a huge +6% jump today and is above $91. Looks like it can go to $95 based on your rising channel shown above.
TA…I did mean (1) in the top chart, per the “true break of support.” Would like to see a 2-3% break of key line that started when Crude hit $40.
Chris, at the bottom of the article, do you mean ‘true break of support at (2)’ instead of (1)?