CLICK ON CHART TO ENLARGE
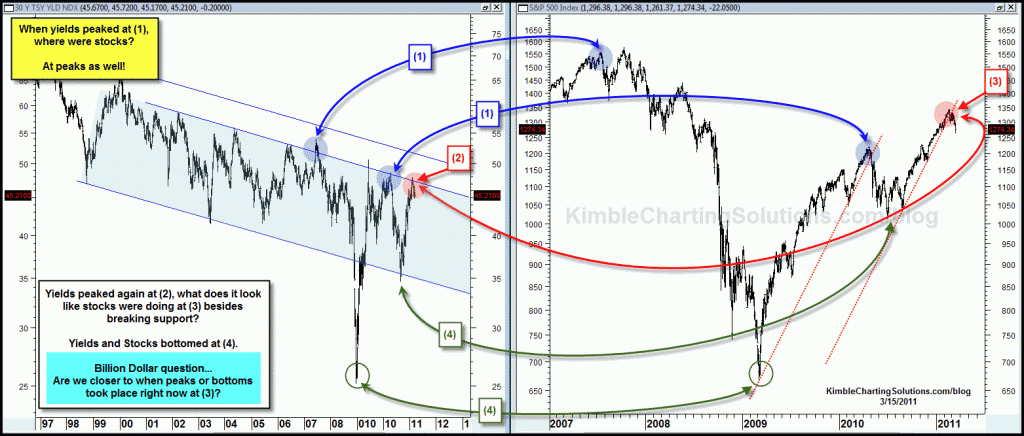
Yes it is a busy chart, sorry! Notice that investors can use the 15-year falling yield channel to make buy and sell stock decisions, by selling stocks when yields are at the top of the channel and buying stocks when yields are at the bottom of the channel.
If history is any guide, are you surprised to see the markets acting soft over the past 3 weeks since yields hit the top of the channel at (2)? Is the break of support at (3) bullish for stocks when you consider where yields are? When you look at the Big Picture is this decline really about Japan???


I appreciate that you show these relationships between bonds, stocks, commodities, currencies… You take some of the mystery out of investing and show the big picture which helps us harvest at the right time. Thanks
Chris,
At first blush, it seems counterintuitive, ie, lower interest rates should be bullish for stocks; however, the lower interest rates are probably a function of money moving from equities to bonds taking advantage of the higher yields; and the rising interest rates ar a function of increased economic activity and money moving from the low yields in expectation of equities rising due to the higher economic activity.
Michael…Thank you for your viewership and kind words. I attmept to specialize in “turning points.” My strategy is called TB&M, which stands for “Tops, Bottoms and No Middles.” I have found over the past 20+ years that patterns can be extremely beneficial in find low risk, high return exhaustion and reversal points. I let the patterns take us where they may Michael, yet attempting to call how big of a rally or decline is a big challenge most of the time. With the big run up in so many commodities, this one could surprise a few!
Hello Chris
Great! And the best is: I bought AGA after reading your post; thanks!!
Also I tried to see that in AGA the first and second order derivatives were slowly decreasing resp. increasing. Now, in ZSL I see the same pattern which honestly confused me.
Chris… as always a brilliant correlation. Given your posts on key trend reversals, do you put effort into how large the correction will be? Or do you let other indicators (dollar, treasuries, copper, etc) guide you? The Fib at S&P ~1220 jumps at me.
Brain…Chicken or the egg thing?
Hey bs…well it would have been smarter the last few days to not be on board SLV for sure! In the link below is my support line to keep or walk. SLV opened on the line and moved higher. Keep in mind that Silver is dealing with the all-time monthly closing back in 1980, at the $35 level. With many assets deflating of late, many of the metals might be a bad thing to own for a while going forward. See what deflation did to AGA today? Wow!
https://www.kimblechartingsolutions.com/2011/03/silver-update/
Hello Chris
Thanks for the graph showing this correlation.
I don’t understand why you are still bullish on SLV, considering a general trend reversal and the massive volume traded on ZSL since end of february!?
Chris,
Any thought as to whether one leads the other?
Zee…all the rate/stock combo chart suggests is that when rates were peaking a few weeks ago, stocks mostly likely were too. Notice that rates went from the top of the channel to the bottom of the channel last September, which was a good time to buy stocks. I recall back then very few investors were bullish. Speaking of the news…I came across a good quote…”News is to the mind, what Sugar is to the body!” Sugar creates a short-term high then what? Much of the news is toxic to portfolios, that is why we have to have tools that we can count on, year after year.
Greg…Thanks for the comment. We live in a complex world, with a ton of moving pieces. As I have shared before, I am not attempting to be right, just “enlarge our portfolios, regardless of market direction, via the “Power of the Pattern!”
Trends changed around 2/24 see below..
https://www.kimblechartingsolutions.com/2011/02/key-trend-reversals-at-hand/
Hello Chris,
So the chart is telling still more damage to be done – and CNBC will say another Black Swan ?
At least now the talking heads have a “reason”. It ought to save them a lot of time coming up with a less obvious reason. You are right, Chris – it was “time”, and the charts told you so!