CLICK ON CHART TO ENLARGE
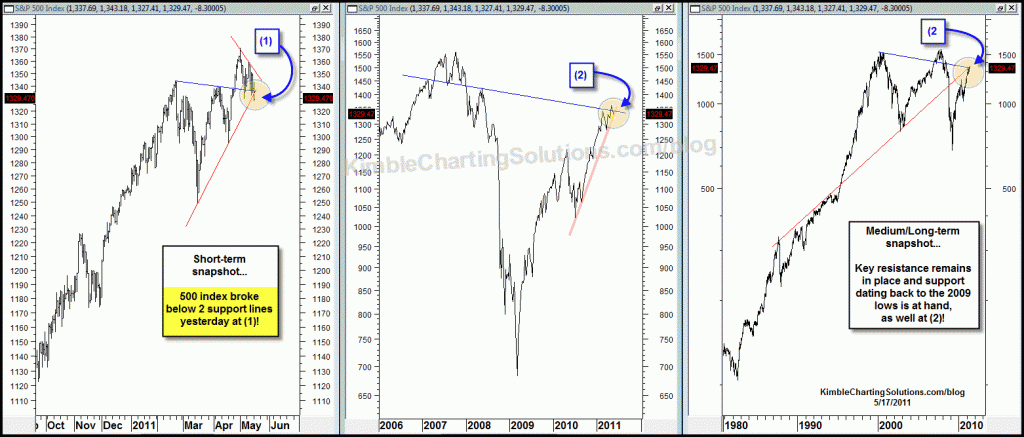
On a very short-term basis, the 500 index broke below two support lines yesterday at (1). This break doesn’t determine a ton, nor create a trend, yet it should be respected! On a bigger picture, the 500 index remains jammed between longer term support and resistance lines at (2).
The chart below was posted on Saturday under the title “Look Alikes, Dominos and Slipper Slides.” (see post here)
CLICK ON CHART TO ENLARGE
Investors need to remain aware that the markets of the world have created similar patterns and if support is taken out in one key index, odds are very high that support across the board will break!!!


