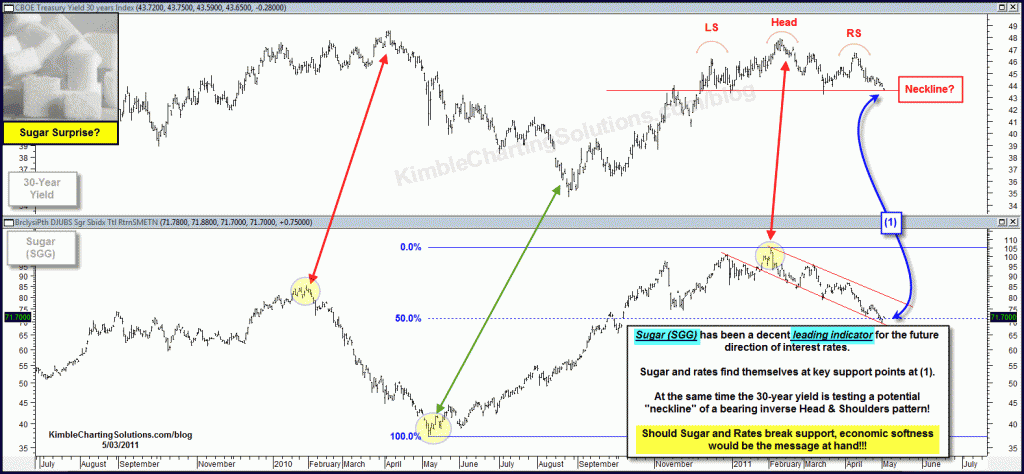
Almost a month ago I shared the chart below, reflecting that “Sugar” has been a good indicator per the future direction of interest rates. (see post here)
CLICK ON CHART TO ENLARGE
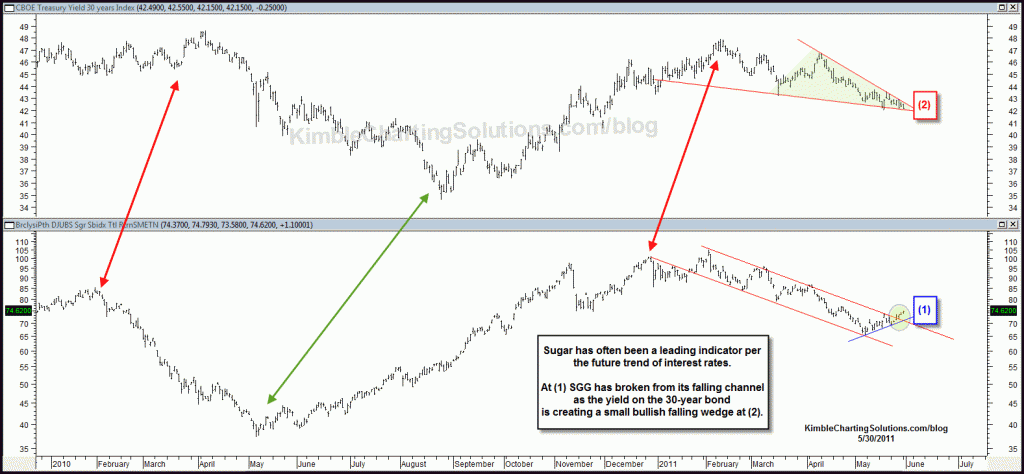
Below is an update on the Sugar/30-year yield chart.
CLICK ON CHART TO ENLARGE
Sugar and the yield on the 30-year bond have both declined a good deal of late. Now Sugar ETF (SGG) has broken above its falling channel as the yield on the 30-year bond has created a bullish falling wedge pattern.
Keep a close eye on Sugar going forward, due to its potential impact on bond holdings and a potential ripple effect on the stock market!


Alan…Think about what is the enemy of a bond? Economic growth or inflation. Each of these are feared by the bond markets. Sugar often leads many commodities higher and lower, which is a growth/inflation issue. Since commodity prices effect bond prices, keeping an eye on sugar has been helpful. Think about this…at the time the biggest bond house in America was shorting bonds, sugar was turning lower, suggesting yields would follow and investors should be an owner of bonds, not shorting them!
Thanks for the question,
Chris
Hi Chris
I find the chart that tracks the correlation between the price of sugar and US Treasuries intriguing. Is this just a weird coincidence or is there some causal relationship between that two that just escapes me?
Thanks,
Alan