CLICK ON CHART TO ENLARGE
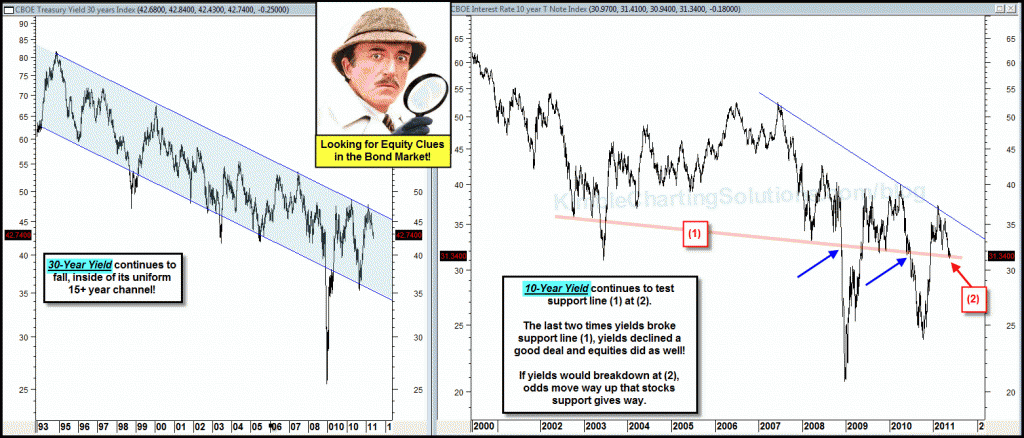
Long-Term yields remain inside of a very uniform falling channel, continuing a series of “lower highs.” The 10-year continues to create a series of “lower highs” as well, bringing yields down to a level/support line (1) that has been pretty key per the direction of stocks the past couple of years.
What happens at line (1) has been a good clue per the short-term direction of stocks the past couple of years…Keep a close eye on the 10-year yield since since the “Global Markets are doing a high wire act” right now! (see post here).


Support is holding so far, sitting right on your line (1) as well as the 200dma.