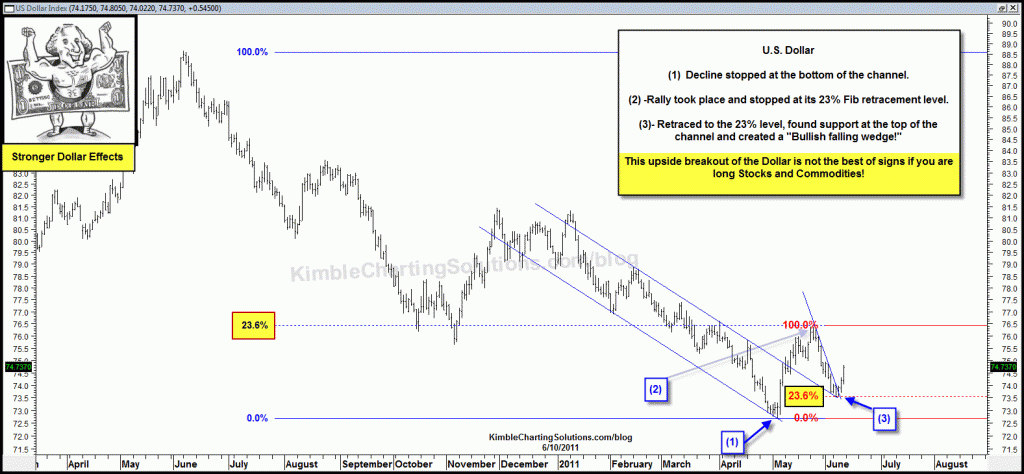
Have shared twice this week that the “Power of the Pattern” was suggesting a U.S. Dollar rally was close at hand…. “Dollar Support” (see post here) and “Dollar breakout” (see post here)
Below is an update, reflecting how key Fibonacci levels are a key to the Dollars movements!
CLICK ON CHART TO ENLARGE
The above chart reflects why knowing/applying Fibonacci levels can be used to your advantage…. since support and reversal points have a ton to do with Fibonacci of late!
With the Dollar breaking to the upside of this bullish falling wedge … All of these posts might even become a little more important!
Resistance dating back to 1987 and 2000 is at hand (See Time the Crash post here)
Russell 2000 was suggesting to short at this giant falling wedges (Russell shorting quiz here).
Risk being as high as it has been in years (See Slippery Slide here)
Homebuilders breaking down from a multi-year flag/pennant pattern (see post here) and last but not least…
When the 500 index broke support and margin debt levels were very high, the 500 Index has declined 50% twice in the 2000’s (Margin debt/500 chart here) Different this time around???
The “Power of the Pattern” has been suggesting for a while that “capital protection strategies”, even for slow monies/401k’s should be taken!
This doesn’t mean anyone has to short at all…just a suggestion that protecting some capital might come in handy!


Aaron…send me an email and I will share a chart with you that you might want to see!
Hi Chris,
Based on the sound reasoning you have provided, I closed out all of my long commodity positions except for SGG (Weird strength today even with a strong dollar, GAZ (relative stength good) and COW (hunch)
There seems to be a lot of ETFs to chose from if one is going to short commodities.
Which one if any would you recommend?
1. AGA
2. DDP
3. DEE
4. CMD
Aaron
Thanks Scott….Sent to premium members a chart that reflects the CRB index has created the same pattern of late, that it did right before the commodity collapse (60% decline) back in 2008. A strong dollar rally would increase the odds of a repeating CRB pattern! We scored huge in 2008 per this pattern, this could be a huge one again!!!
Oil futures knocking out a mean 1-month pennant right here Chris, maybe worth a look.