CLICK ON CHART TO ENLARGE
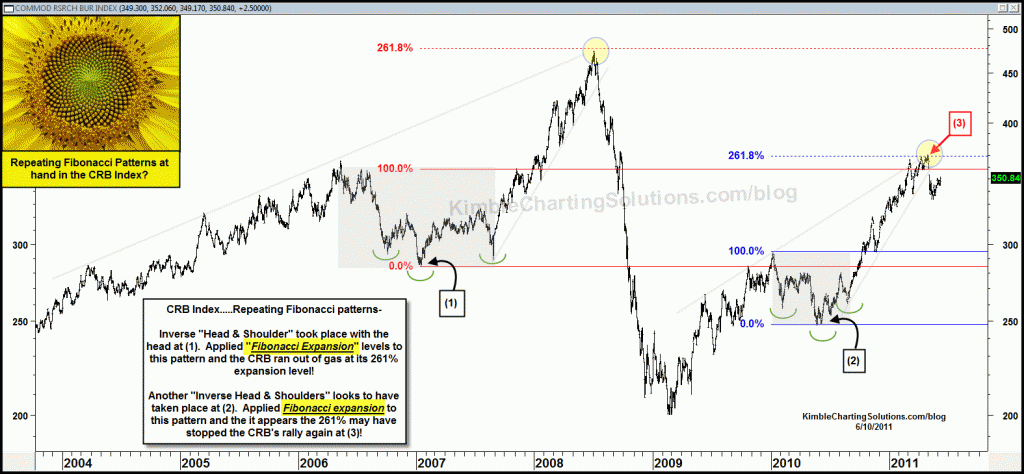
CRB created an inverse Head & Shoulders pattern at (1) and rallied to a Fibonacci 261% expansion level at the top of a bearish rising wedge…results after this took place - CRB broke resistance and a massive decline took place.
The CRB looks to have done the same thing at (2), per creating an inverse Head & Shoulders pattern at (2), rallied to its 261% expansion level at the top of a rising wedge.
Shared this chart to Premium Members last week that the “Power of the Pattern” was suggesting a greater than a 65% chance of a very large decline in the CRB index was about to take place!
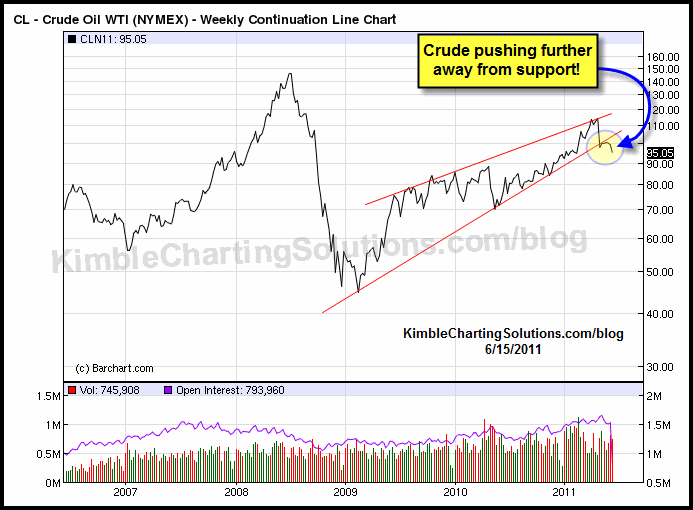
I shared a few days ago that Crude Oil was pushing support to its limits … (see post here) Odds go way up that Crude Oil could work its way towards $60 if the top of the channel dating back to 1983 is taken out!
See update on Crude oil’s support test below!
CLICK ON CHART TO ENLARGE
If the “Power of the Pattern” is correct in the top chart… the CRB & CRX index and Crude oil will witness some pretty strong selling pressure.


King Dollar on a Weekly basis has a 74 period Cycle Low being put in now
Aaron…yes. On a 30-year overvaluation perspecitve, Silver remains very high, which would me a big risk!
See this chart that helped us short silver at $48! Members did a market neutral spread at this time Aaron, per went long gold and short silver (ZSL). This MN strategy worked really well as ZSL was up over 40% in a weeks time.
https://www.kimblechartingsolutions.com/wp-content/uploads/2011/05/goldvssilverrelativestrengthmay15.gif
Hi Chris,
In your opnion,is Silver poised to follow the CRB to the downside?
Thanks,
Aaron