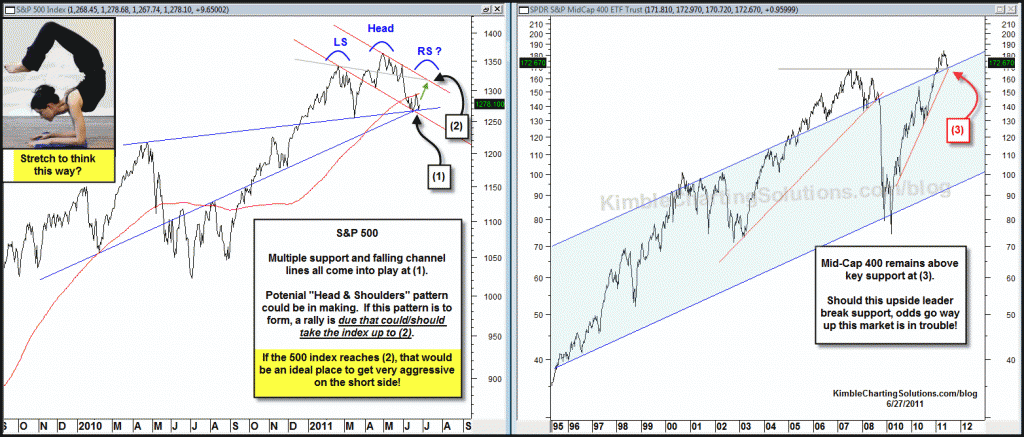
It might be a “Stretch” to think this way…yet the pattern below remains very possible.
CLICK ON CHART TO ENLARGE
On a short-term basis, several short-term support lines have come into place for the 500 index and on a much longer time frame, the Mid-Cap index finds support is at hand at (3).
A potential “Head & Shoulders” pattern could be forming in the 500 index, with the Right shoulder yet to be completed.
Yes it could be a “Stretch“ to think this way, yet the patterns do suggest a short-term rally is due and aggressive investors will want to be open to taking inverse positions where resistance comes into play at (2).
Mid-Cap 400 index, which has been an upside out performer (see post here) remains above key support.


Norman….I say “potential” due to it looks like the pattern is forming…. yet the “Right shoulder is NOT complete” at this time. If the 500 index can rally up to ther “potential” right shoulder, that is where aggressive investors will want to look at taking new inverse positions.
I am attempting to give a heads up before it happens. If this market would just fall out of bed right now…the right shoulder would never have formed.
Thanks for the comment/question,
Chris
Hi Chris,
You write in the text ”A potential ”Inverse Head & Shoulders” pattern could be forming…..”.
You write in the graph ”Potential ”Head & Shoulders” pattern could be in making”.
I guess the right definition of the pattern is the one in the graph and not the one in the text. This is not an inverse pattern.
Right or…….. left.
Normand