CLICK ON CHART TO ENLARGE
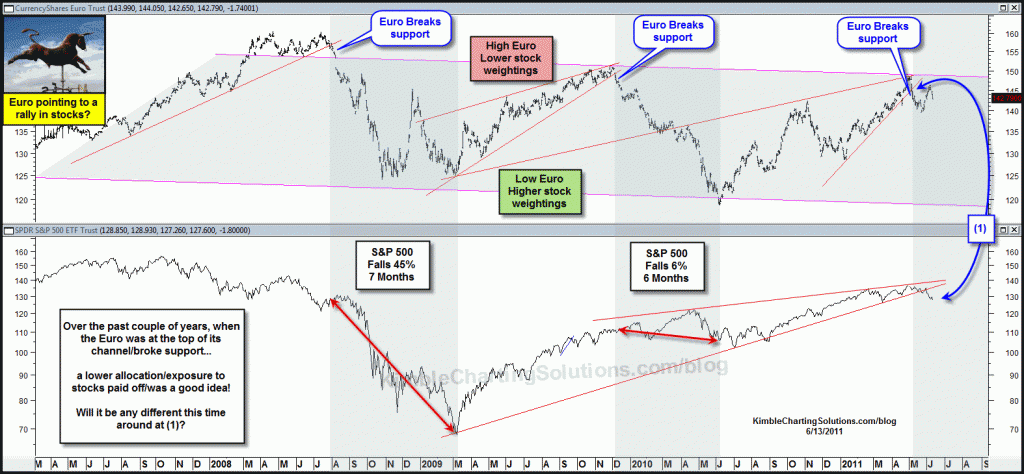
No tool is flawless/the holy grail…yet the Euro has been a good tool, per helping investors build portfolios, (know when to have a large exposure or a smaller exposure to stocks), over the past couple of years.
As one can see from the chart above, when the Euro was at the top of its trading channel and it broke support, it wasn’t suggesting the sky was going to fall, yet it has paid off to limit longer-term exposure to the S&P 500….is it going to be any different this time?
The market is down 6 weeks in a row and bullish sentiment has dropped off quite a bit, so a short-term rally is very possible.
From a longer-term perspecitve, do keep in mind that the Euro does remain at a level that very high long-term equity exposure to stocks hasn’t been very rewarding to investors.


Said another way: Euro weakness = U.S. dollar strength, which often correlates to poor-to-middling behavior in equities as the U.S. dollar strength usually comes from a risk-off sentiment among investors. I believe Chris posted the U.S. dollar bouncing from support chart recently as well.
Len…Sorry for any confusion.
What has happend twice when the Euro was at the top of the channel? Once a large decline..45% in a few months, the other time a sidewasy grind, per the 500 index fell 6% in 6 months. With the Euro at the top of the channel again, it is suggesting an “Underweight position” in equities.
Thanks for the email and viewership,
Chris
Ok, this is a bit confusing to me. Normally I get most of the charts. Is the rally question being sarcastic?
All the other charts point to a possible continued correction. Per the verbage on this chart, not the chart itself, it appears we may rally. To confusing when on the same page we have so many conflicting arguements.
Bottom or no?
And a confirming indicator of a correction in all commodities after a short term rally.
Chris,
This seems to me that this is just a secondary/confirming indicator of the strength of the US $.
Gary