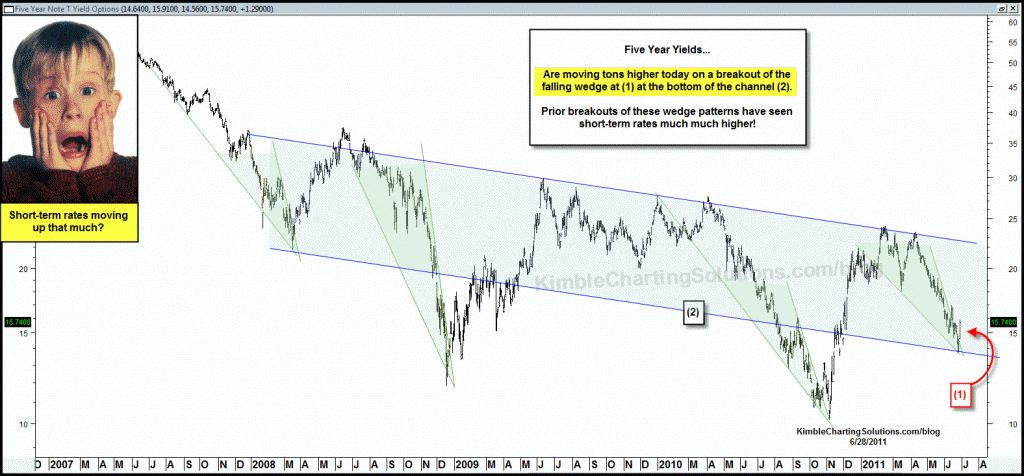
Shared the chart below yesterday, reflecting how the yield on the 5-year note had created several bullish falling wedges over the past 3 years. (see post here)
CLICK ON CHART TO ENLARGE
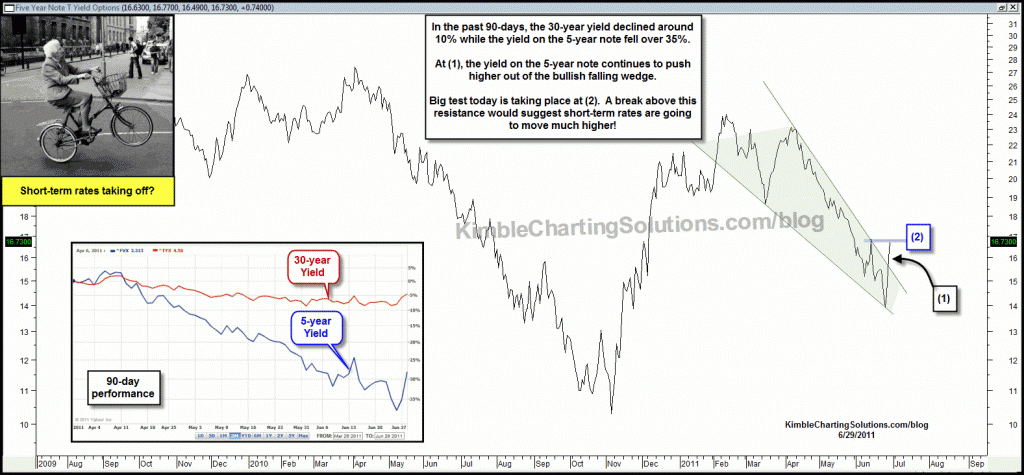
The chart below reflects that the yield on the 5-year note had declined over 35% in the past 90-days, much more than the yield on the 30-year bond.
CLICK ON CHART TO ENLARGE
The yield on the 5-year note is pressing on short-term resistance this morning.
Yesterday I mentioned that TBX or TBZ should do well on an upside breakout in yields on the 5-year note. If yields can break resistance at (2), TBX and TBZ should do really well!


Scott… I use a staged entry/exit system per renting the high yields. Am currently a third into them at this time and if price moves higher above other EMA lines, the exposure will increase.
Chris, are you actually reentering (as you would say re-renting) high yields as they recover in price, or steering clear?
Scott…Always a great question, per where do fund flows go… as you know we started selling high yield funds weeks ago, when they started crossing key moving averages.
High yields last week saw the LARGEST WEEKLY REDEMPTIONS in the history of the funds. Wonder if some of these people were a little late to the part there!!!
Chris, where does the money go, back into risk. High yield is retaking the EMAs you like to watch. And look at the VIX today. Was that the correction?