CLICK ON CHART TO ENLARGE
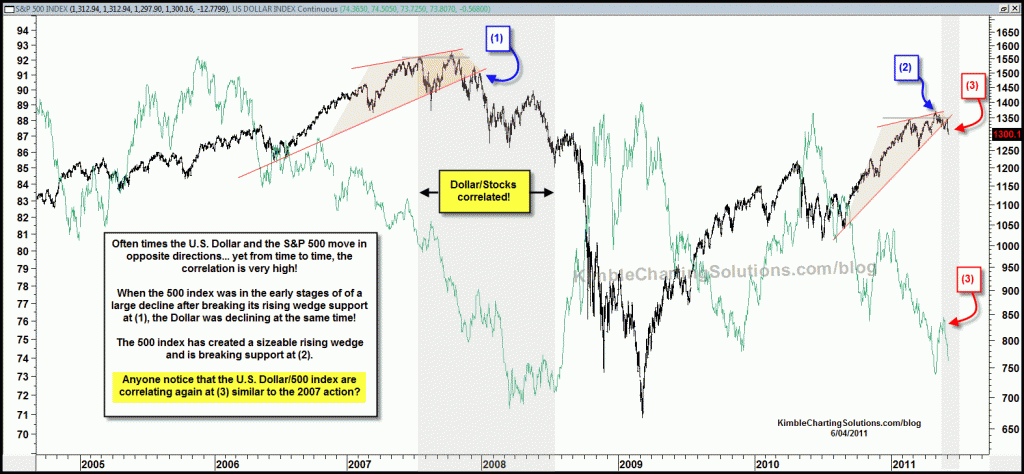
Even though the Dollar and the 500 index go their separate ways most of the time, during a very critical time in the financial markets, they correlated very highly for almost a year. Know when? Mid-2007 to mid-2008. This took place after the markets Double topped at (1) and broke to the downside from a rising wedge.
Too early to tell, yet the 500 index may have double topped at (2), while breaking support at (3), all the while the Dollar is falling, almost just like the action in 2007! I am never one to believe that any given year will repeat another, yet these are some very interesting patterns that are looking/acting like a prior key event.
Are these two hinting at something from our past? If so, the “Look Alikes, Domino’s and Slipper Slides” charts become very important! (see post here)


Stemphos….Awesome job of looking for and spotting relative strength!
Investor X…Thanks for sharing and great comments.
With TLT up against two fib resistance levels and at the top of a rising wedge (see link below)
https://www.kimblechartingsolutions.com/2011/06/multiple-fib-resistance-going-to-stop-the-tlt-rally/
and the put to call ratio is at levels where bottoms have taken place since 3/2009 and bullish sentiment levels at readings where the 500 index is much closer to a low than a high and support is still not broken, will it get taken out by a good percentage?
Van…put to call ratio was very high on 9/1/201, which was the low before the semi-melt up you mentioned. Right now the put/call ratio is almost as high as it was on 9/1/2010.
Bullish sentiment is way on the highs earlier this year, actually at levels that since 3/2009, were much closer to market lows than highs…see sentiment in the link below
http://www.bespokeinvest.com/thinkbig/2011/6/2/just-when-you-think-its-safe-to-get-back-in-the-water.html
Hi Chris,
When stocks take a hit in the US, I like to see which markets seem to hold up. Now they might be strong due to a weak dollar, but a few might be headed higher for other reasons
1. GXG
2. IDX
3. ECH
4. EWM
5. ENZL
Also, TUR may be ready to go higher
Any thoughts?
Aaron
P.S. Why do you think Europe is holding up so well the last week or so?
The Hilbert Sine Wave is indicating a Cycle Low in the Dollar & a Cycle High in the Euro (which is 80% the inverse of the Dollar), Equities & the Dollar are still inversely correlated at this point ,Equities are just ahead of the Dollar using the breaking of the rising wedge as a landmark
Chris K,
Of course we could have said the same thing about call buying in early Dec before the semi-melt up thru Feb?
Chris… Thanks for the kind comments. I am not a bull nor a bear, just attempting to use price and patterns to our advantage.
As I shared this past week, I feel risk should be defined as “how many investements does an investor own, that act the same!” This is my 31st year I have been in the business of building portfolios and the world is a ton bigger population wise when I started in 1980, yet due to the ease of information, I feel the world has become a very small place over the past few years. My mentor/teacher and hero, Sir John Templeton was very successful in many ways, one of them was using diversification as a tool to reduce risk. With the majority of the worlds markets correlating around the 90% level I can’t help but feel investors should be cautious right now with the majority of the worlds markets creating rising wedge patterns (which is bearish 65% of the time).
Diversification works until it doesn’t…great post Doug Short did a year ago. check out the lower chart in this link. Doug did a great job of showing, in an equity decline, the correlation becomes very high, around the world!
http://dshort.com/articles/2009/diversification-overview.html
Craig…First off, Thank you for your viewership, much appreciated. Great observation Craig per the VIX not reacting well. A couple of observations… In the past when the market declined, people got really scared and the VIX shot up, which then the market created a bottom quickly. So is the lack of fear/vix jumping up a negative sign for the markets? On the other side, the put to call ratio is very high, tons of put have been bought about 10 days ago. This reflects a ton of bearishness, which if history is any guide, investors want to buy the fear and go long here…so do the VIX players realize this so they aren’t pushing VIX higher? At the same time Craig the number of investors bullish has dropped off a ton recently. Another observation from the VIX players?
Doug…Great “glue factory” comment! Might keep an eye on FXA Doug.
https://www.kimblechartingsolutions.com/2011/05/u-s-dollar-is-getting-knocked-around-tonight/
Chris: of all the blogs I read, yours is the only one pointing out what a potentially perilous situation the markets are in! And you have done it in a variety of cogent ways. Thanks for bringing our attention to this critical moment! Chris G
I just discovered your blog and love the relationship charts! Nice work. A question… do you recall a time where the stock market has fallen 5 weeks (trend lower) with such a complacent advance from VIX?
Well, if the $ takes a similar drop now as it did in 07-08 then it’s going to be an all time low.
I guess the EURO will end up being the best looking horse in the glue factory.