CLICK ON CHART TO ENLARGE
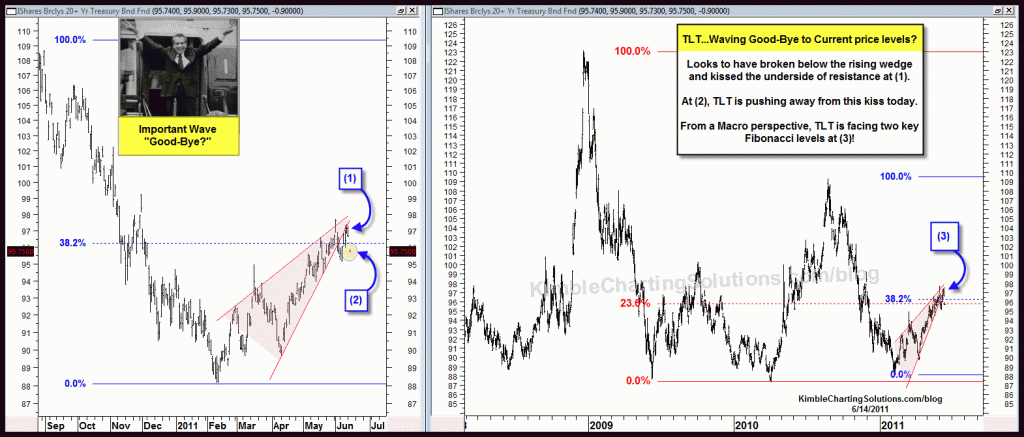
TLT has not had a major breakdown at this time, yet the “Power of the Pattern” was suggesting that TLT could run out of upward momentum. Did this chart hit the high of TLT to the DAY? (see post here) .
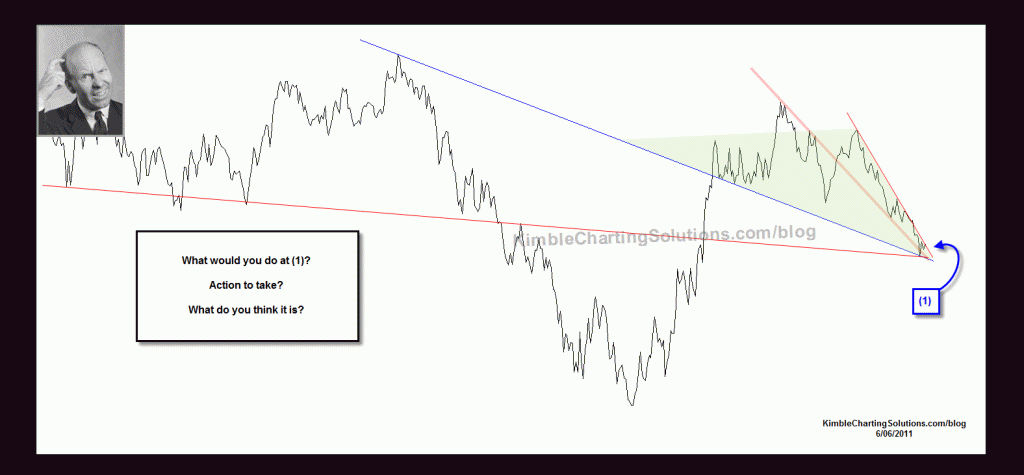
The Quiz below from last week was the 10-year yield, inverted. The “Power of the Pattern” in the chart below was suggesting to long bond yields (they should move higher) or short govt bonds.
CLICK ON CHART TO ENLARGE
TLT coming to the end of rising wedge (top chart) and meeting two different Fib resistance levels at the same time is rare and should be respected for the damage it could inflict on bond prices and the macro message it might be sending!


Mark….Is TLT an outlier? Stocks down, bond prices up, pretty normal. With bullish sentiment so low, often times bond prices are at highs, which is what the TLT charts of late have been reflecting. Yes many equity breakdowns have taken place, which in my opinion has ushered in a very surprising level of concern, with such a small decline! Stocks are less than 10% off the highs of late and the sentiment polls seem to reflect much bigger decline has taken place. In the past when sentiment was this low, stocks have witnessed a much larger decline.
Many people have emailed me wondering if TLT declined, would stocks move higher…one day a trend does not make, yet so far that is the case.
So the TLT pattern looks like a real outlier – all the other patterns shown on the site point to the danger of a stock decline (cattle, base metals, high-yield – from earlier posts). Only TLT (and the low bullish sentiment) suggest a reversal towards lower bond/higher stock prices. Puzzling over this… I think Chris’s answer will be: forget the puzzle, just follow the pattern! (Right?)
Andrew… about 6 weeks ago, bond prices started moving higher and rates headed lower and what happened to stocks during that time frame? A 6 week decline in equity prices. If rates are at a low and they head higher, what usually happens in the stock market more often than not?
Where did the Bulls go? see link below….more often than not, is the stock market closer to a short-term low or a high when bullish sentiment is this low? Does this sentiment go along with high bond prices, at a point where they could turn lower? yes!
https://www.kimblechartingsolutions.com/2011/06/where-did-the-bulls-go/
what is the macro message that you think higher bond yeilds/lower bond prices say?