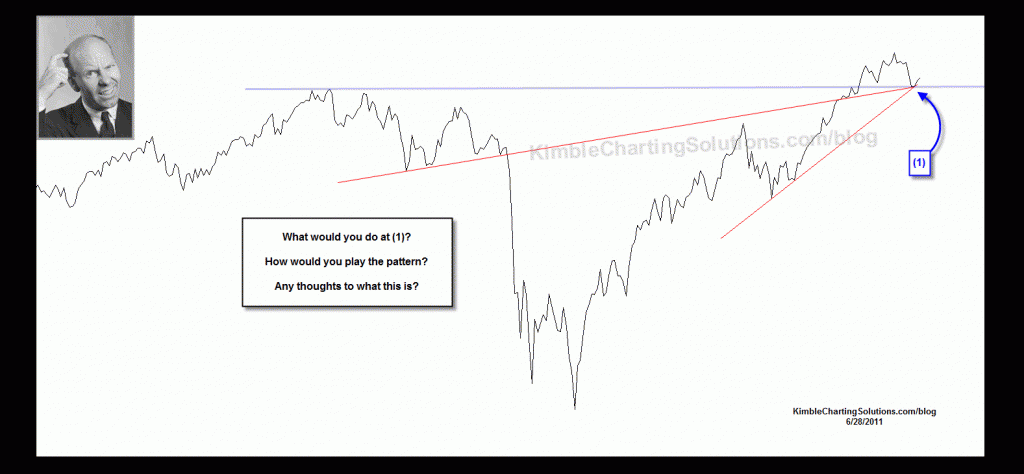
Below is the quiz of earlier this week…Thanks for the massive global response. For many this was an easy quiz!
CLICK ON CHART TO ENLARGE
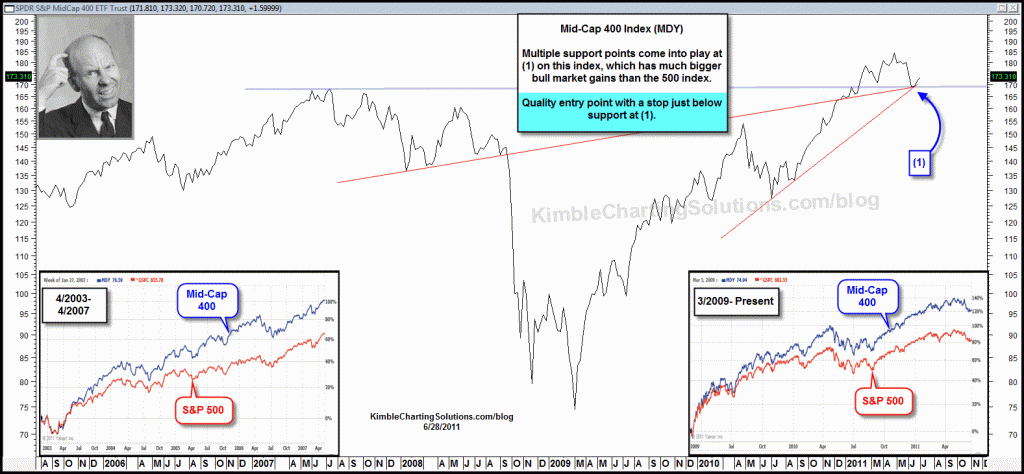
Below is the answer to the quiz…
CLICK ON CHART TO ENLARGE
The above chart reflects that the Mid-Cap 400 index outperformed the 500 index by at least 50% in the two time frames cited above.
MDY was on key support at (1) and support is support until broken for the bull market leader!


