CLICK ON CHART TO ENLARGE
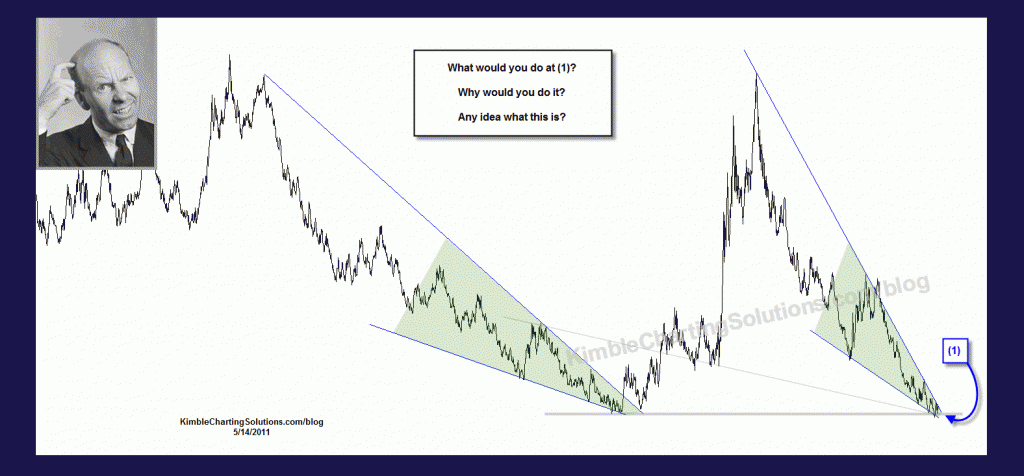
The chart above was the quiz of May 15th (see post here) A falling wedge suggests a two-thirds chance that an asset will rise in price. This situation is a little uncommon, in that two falling wedges have taken shape at the same price level/double bottom at (1). As you can see the first falling wedge led to a rather large rally in price. Below is an update to this chart.
CLICK ON CHART TO ENLARGE
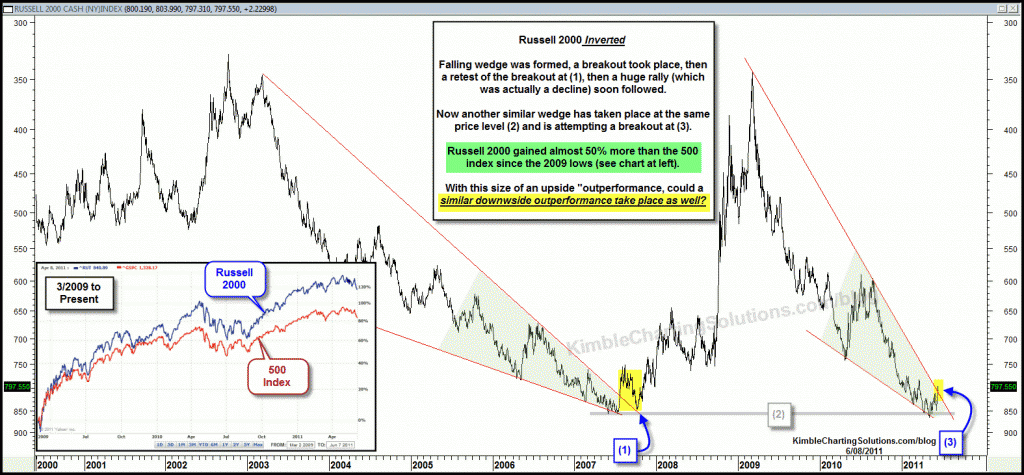
Falling wedges suggest more often than not, a rally is to take place. Add the potential that a double bottom is at hand, increases the odds of a rally.
Why invert a chart? Some say, “buying low and selling high” is a good idea. If you are wanting to hedge a portfolio or want to attempt to score on defense, this chart reflects an opportunity to Buy low is at hand” at (3), with a stop below line (2).


Stephen….will have to watch it unfold. The market tends to like to fool the majority. Since 1,250 is the most talked about number on the street, per the 500 index, I suspect it will become meaningless!
Hi! Chris,
Great work. So any downside targets yet for RUT?
Might be good to clarify that rwm is the equity to buy low?
350 is the double top on this inverted chart, which is actually the Double Bottom for the Russell 2000. Your question per way above 350, way too soon to tell and so far these upside break in this inverse falling wedge has not taken place as of yet.
Do I gather it right the up move potential on this chart is way above 350, then?