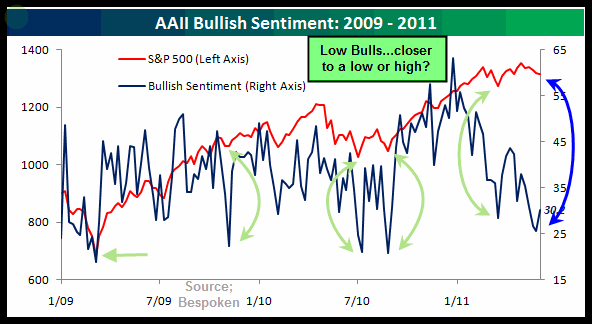
The number of investors “Bullish” has dropped off a ton in the chart below. On 2/18 the 500 index closed at 1,343 and yesterday it closed at 1,286. This decline represents less than a 5% drop in price, yet look how the current sentiment level compares with the highs on 2/18!!!
CLICK ON CHART TO ENLARGE
I am a little surprised to see the number of investors Bullish drop off as much as they have. (see link to sentiment chart here) If history is any kind of guide since the 3/2009 lows, these sentiment numbers suggest that for the short-term, the market could see a little rebound around support!
With the markets at/close to support dating back to the lows in 2009, does this low of a sentiment number mean too many bears have come to the party before they should have? If history is any guide, this sentiment number would suggest that you might want to be cautious right now if you are loaded to the gills on the short side of the fence.


Thanks Andrew….For years I have been a believer that stories/pictures are remembered and facts are forgotten. I am honored that they might bring a little smile to you and others. Thanks for the kind words,
Chris
“Investors” are so nervous nowadays that they stampede from one side to the other at the first sign of change. I’m desperate for some nice long trends to develop. It’s hard to make good money in this environment.
Very informative and entertaining charts. Sentiment Index is reflecting the fear of the EU and the PIIGS possibly defaulting in the future.
So much debt for all in the USA and the EU that it is hard to imagine a booming stock market or any economic growth of over 3% for next year. Looking pretty weak according to the recent data.
have to say, that the pictures you add with your charts are always entertaining