CLICK ON CHART TO ENLARGE
The S&P 500 seemed to pick up downside speed, once Wheat futures broke support back in 2008 at (1) in the chart above.
Now Wheat is breaking support at (3). Would a breakdown in grains impact the stock market in this time around?
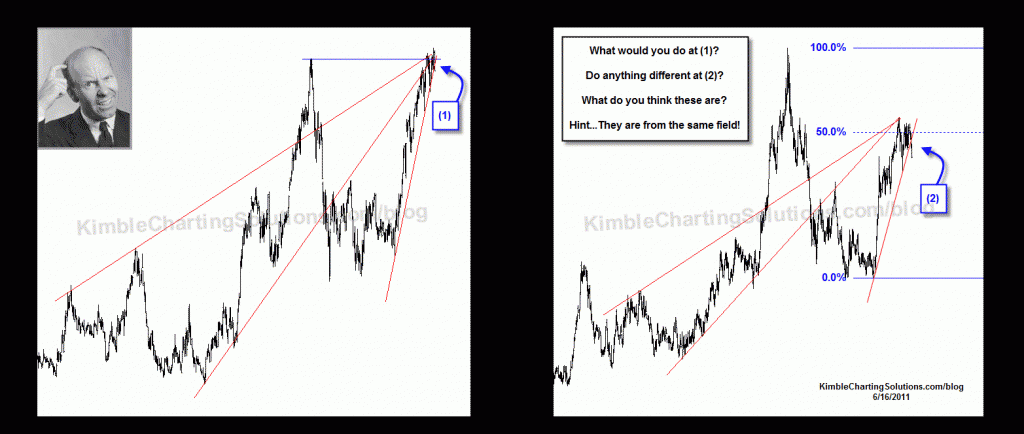
What does a grain chart look like these day? Any chance they look like the charts below, which was yesterdays quiz? (see what an opportunity here)
CLICK ON CHART TO ENLARGE
The patterns above suggest about a 65% chance of these products falling in price…. Wheat and Corn fell almost 4% yesterday, not a bad day for those scoring on defense in these areas!!!
If they do break to the downside, I suspect they will impact the stock market…..again! Keep a close eye on the grains for more macro clues.


