CLICK ON CHART TO ENLARGE
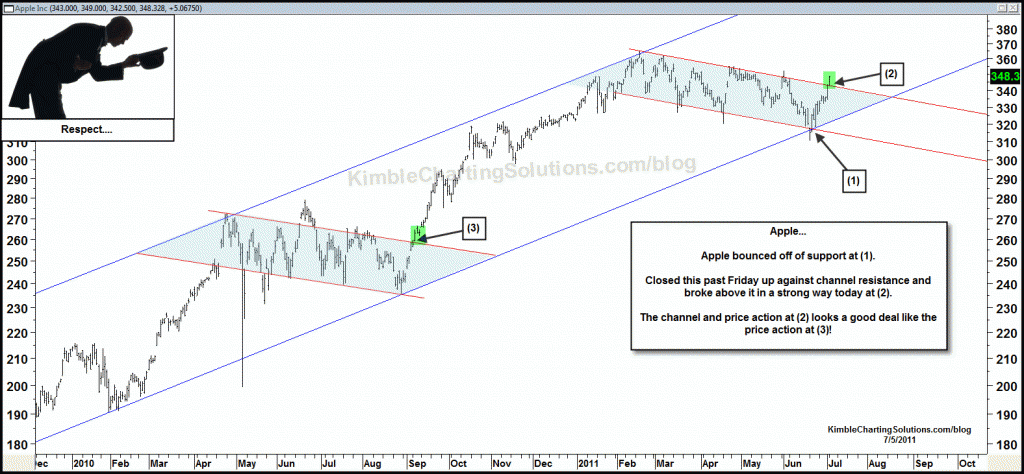
Apple broke above channel resistance on 9/3/2010 at (3) in the above chart and then rallied to the top of its channel over the next 5 months……gaining almost 30% after the breakout!
The chart above was posted 2 days ago, sharing that the breakout of this bull market leader should be respected and that the broad market could follow Apple NOW…….. just like it did last year. (see post here)
Pre-market this morning I shared that it was time to watch and follow quality barometers…Copper and FCX, due to being up against resistance. (see post here)
Below is a 4-pack updating that Apple, Mid-Caps (MDY), Copper and FCX-
CLICK ON CHART TO ENLARGE
From a “Power of the Pattern” perspective, the Apple breakout was suggesting higher prices were ahead and now these other key market sectors look to be sending positive price messages as well.


Luk….Just because Apple is doing well, it doesn’t mean that it can or will overpower the broad markets and key patterns such as the possible H&S pattern.
Despite the strong rally on both sides of the 4th of July 3-day weekend…key resistance dating back YEARS, was not taken out.
https://www.kimblechartingsolutions.com/2011/07/800-lbs-of-resistance-weighing-heavy-on-the-broad-market/
So, if I get it right, the dreaded and high-probability head-and-shoulders scenario has been thrown completely out of the window…
Correct? What a surprise…