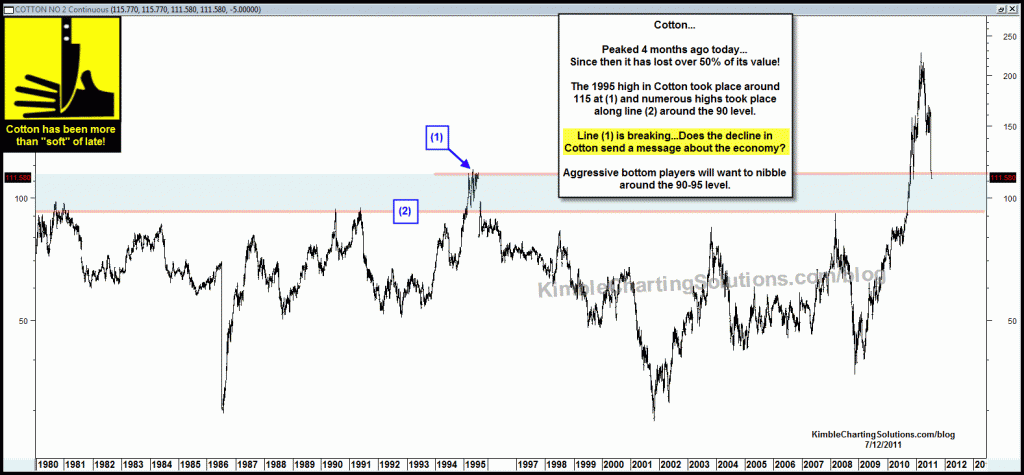
The chart below was published on July 12th (see post here) reflecting a 50% decline in Cotton had taken place over the past few months.
I wanted to update the Cotton chart because it is fast approaching potential support prices cited below.
CLICK ON CHART TO ENLARGE
Below is an update to the above chart, reflecting that Cotton has continued to decline, yet it now is approaching potential price support points targeted in the above chart.
CLICK ON CHART TO ENLARGE
Cotton is fast approaching levels cited a couple of weeks ago, that aggressive investors could consider picking up some BAL, with stops below key support.
This is a very fast moving ETF…buying this fast moving ETF should only be done if you are an aggressive investor!


