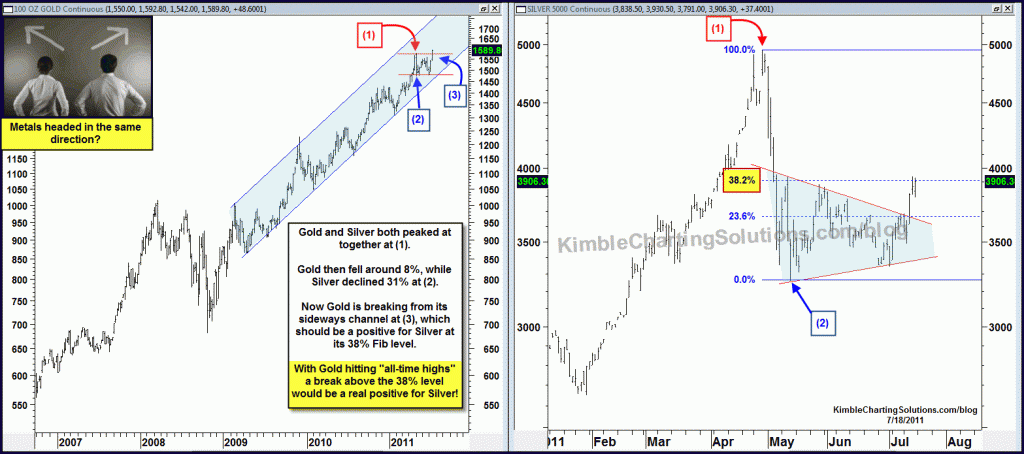
The “Power of the Pattern” suggested to harvest Gold position on 5/2 (see post here) Due to resistance Gold declined almost 8% in few weeks.
On 7/13 the patterns reflected that Gold ETF GLD was breaking from a sideways channel, which reflected a NEW BUY SIGNAL FOR GOLD due to the breakout (see post here). Gold has continued to push higher after the breakout.
While Gold declined 8%, Silver declined over 30%…..Silver chopped sideways between the low and its 38% Fib level for several months yet a change from this sideways patterns looks to be in the making….
CLICK ON CHART TO ENLARGE
With Gold breaking to new all-time highs…a break above Silvers 38% retracement level and sideways channel would be a VERY positive event for SLV.


SLV is looking ROCK SOLID and EXTREMELY bullish to me now. I’ve just created a number of charts, using various indicators, in different time ranges. I almost fell off my chair! WOW! I could be “way wrong,” but, gee willikers…
Aaron….Ironic the 38% retracement level is right at $38 on SLV. SLV is designed to track the chart I shared, which is silver futures.
Chris,
I try to use SLV to track silver. What is the 38% retracement level for SLV?
Are the chart above and SLV closely correlated?
Thanks,
Aaron