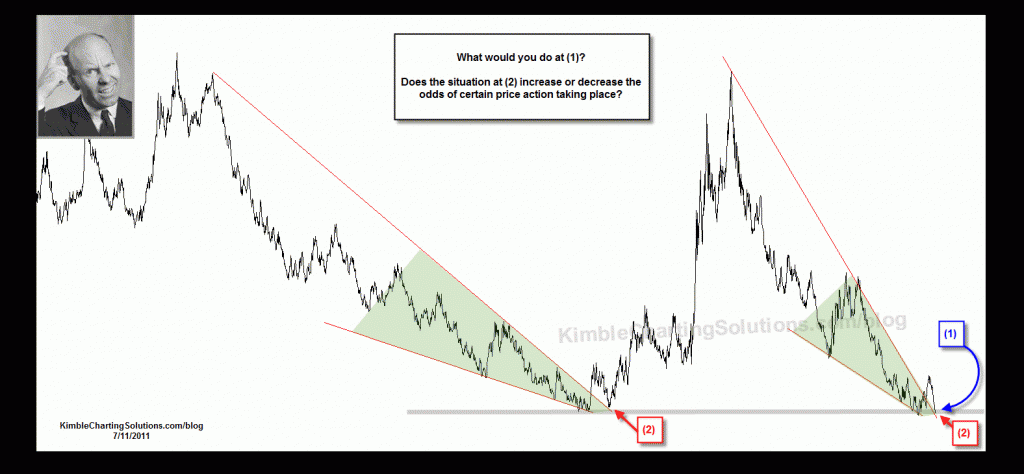
Thanks for all of the fantastic responses from around the world. I am honored and humbled that so many of you respond to the quiz’s and find them of value. Great comments and game plans expressed by all! Many of you picked up correctly on what it was and that it was an update to a prior quiz.
Most common incorrect thought was that the chart below was the VIX index. I can sure understand why. Before sharing the answer, below is the quiz from Monday.
CLICK ON CHART TO ENLARGE
Below is the answer and a potential game plan for the patterns at hand…this “Power of the Pattern” set up could almost be too good to be true!
CLICK ON CHART TO ENLARGE
I am not amazed that the Russell 2000 broke from the wedge and retested it as support back in 2007 at (2) and is doing the same thing at (2A) yet I am surprised that the almost exact same pattern is repeating at (3)!
This ”Power of the Pattern” set-up suggests that aggressive investors would want to pick up RWM (inverse Russell ETF) and put a stop on it should the Russell break below line (3), which would represent a breakout in the Russell 2000…..Too good to be true/repeat? Very well could be! Stay tuned, the outcome should be fun for all!


