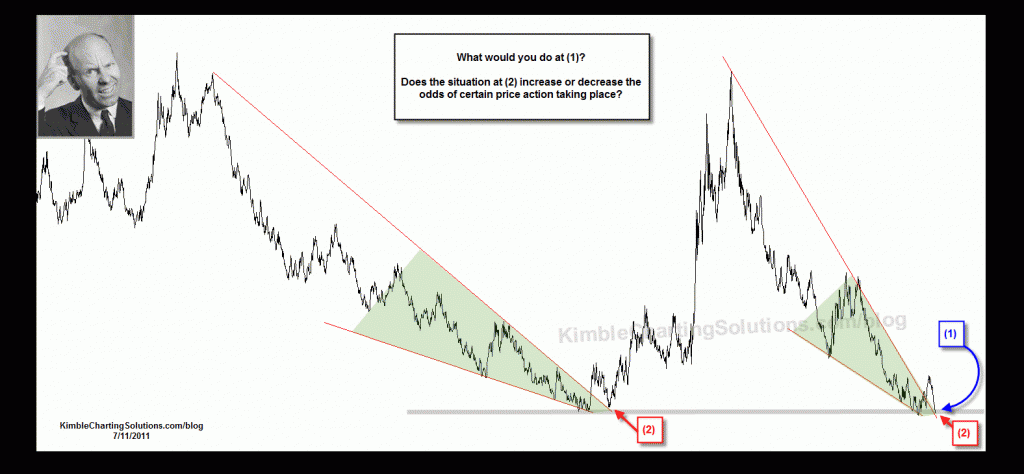
Below is the quiz from July the 11th (see post here), which reflected repeating falling wedges with a retest of support at (2). The “Power of the Pattern” was suggesting that if a rally was to take place, now was the time. See Quiz answer here and an updated chart below
CLICK ON CHART TO ENLARGE
Below is the answer to the quiz, which reflected that the first time this falling wedge formed, a massive rally took place and a similar pattern was taking place again, with a test of wedge support and a double bottom test at hand at 2A.
CLICK ON CHART TO ENLARGE
These patterns can test investors patience for sure, because they take MONTHS TO FORM….. NOT DAYS OR WEEKS! The choppy markets can frustrate both the bulls and bears. Understanding these patterns and when to lower exposure, has been priceless to understand in the past and will continue to do so in the futrue.
Is the frustration worth it to take risk off the table due to a pattern like this? They may be frustrating to wait on, yet understanding their macro message and implications and how much risk to take is key per building a portfolio. This knowledge will become worth a ton of extra money months and years from now! Over time these big picture patterns become beyond WELL WORTH IT!
Did the huge wedge in 2007 suggest that a financial crisis in 2008 was around the corner? NOPE! It just suggested to harvest values and raise cash. Is a duplicate pattern today suggesting another financial crisis is around the corner? NOPE!
These patterns are awesome risk management tools, not crystal balls to the news events of the future.
The above pattern in the quiz suggested to take risk off the table on July the 11th, which at this time looks like it missed the highs for the Russell 2000 by 2 business days. Below is an update on the this pattern.
CLICK ON CHART TO ENLARGE
The “Power of the Pattern” in the above inverted charts reflected that odds were two-thirds that the Russell 2000 would fall in price.
With this pattern at hand the message was to raise cash and see if the pattern fails. This pattern suggested that stock market risk was very high back in 2007 and the pattern was suggesting that similar risk was at hand again three weeks ago.
The Russell index DOES NOT reflect much of a “Head & Shoulders” topping pattern, yet the Wilshire 5000 (weekly) does look like it has formed this bearish pattern, sending another message that these aren’t the best of times to be brave, per having large exposure to the stock market. (see Wilshire H&S)


Ultron….great comment! Was Ben in office in 2007 when the first Russell pattern was in place? Nothing wrong with “not shorting” key to this pattern and the one in the link below is “HANG ON TO YOUR CAPITAL” These patterns suggested to do so weeks ago and the message remains the same.
https://www.kimblechartingsolutions.com/2011/08/not-too-pretty-or-funny-from-a-pattern-perspective/
From a “Power of the Pattern” perspective…Risk hasn’t been any higher than it is right now in the link below…
https://www.kimblechartingsolutions.com/2011/08/has-risk-ever-been-higher-correlation-risk-that-is/
A week ago all the buzz was about the “debt ceiling” now its about global softness….look at Crude oil, its now below $89… The patterns for the past 90 days have given one message and one message only…when the entire world has created bearish rising wedges….be very careful with your capital.
No matter how hard I work, these patterns are wrong 35% of the time….when they are correct on a global scale and capital is on the wrong side of these patterns, it isn’t pretty nor funny!
All the best,
Chris
I’d feel a lot more confident about shorting if I didn’t think the Bernankster wasn’t going to step in with QE3 any moment now!