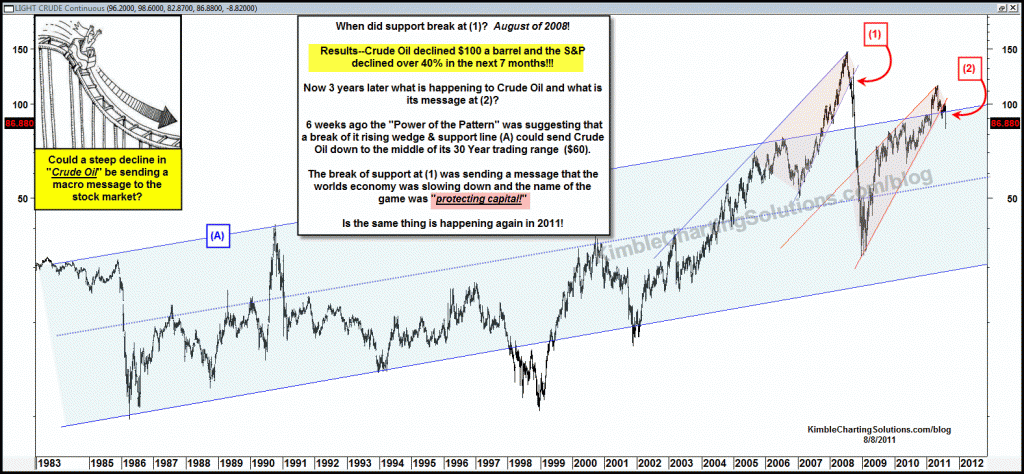
Around 6 weeks ago the “Power of the Pattern” was suggesting a two-thirds chance that Crude Oil could fall to the middle of its 30-year trading range, around $60 a barrel. (see post here) A break of support in August of 2008, sent a message that “capital preservation” was best theme when constructing a portfolio.
Once Crude Oil broke support in August of 2008, the S&P 500 fell over 40% in the following 7 months! Different this time around?
CLICK ON CHART TO ENLARGE
The chatter this morning is about the S&P downgrade of U.S. Debt, announced after the close on Friday. In my opinion a much more important macro message was being sent by Crude Oil, WEEKS BEFORE THE DOWNGRADE, per what shape the global economy is getting into and how investors should construct their portfolios.
The “Power of the Pattern” was sharing last week that “risk had never been higher” (see post here) and that “commodities/MS Commodities Index were very much at risk too” (see no place to hide in commodities)…
What is the theme the patterns have been suggesting for weeks and weeks? Capital Preservation is key!!!
FYI- At this time I am not including GOLD in the “commodities should decline camp!” I am referring to the CRB Index and the MS Commodities Index.
Last week I shared that Gold could hit $1,900 per ounce, based upon Fibonacci “Extension/Expansion” levels (See post here)….am long Gold and will stay that way until support is broken. I favor Gold over silver, due to global concerns…Gold did ok in 2008, Silver was a different story.


Han….I respect Brent a ton, since it is more of a global view….yet the pattern in Crude in 2008 worked well and it looks like it is again. Great question and Thanks for your viewership and comment.
Chris
Han…NG has really has trouble getting out of its own way….I am not really interesting in it…majority of people attemtp to trade it via UNG and that ETF has big time challenges all by itself!
Another question is about Brent oil.
Nowaday, the spread between brent and WTI grows.
When it comes to the brent oil, the support is near $105 even though WTI is under $100.
Which one can be the landmark of the oil?
Hi~ Thanks for your nice charts.
What do you think about the natural gas?
(https://www.kimblechartingsolutions.com/2011/04/natural-gas-flag-breakout-in-early-stages)
Can the flag/pennant breakouts of natural gas occur?
If oil go down, does natural gas follow oil ?