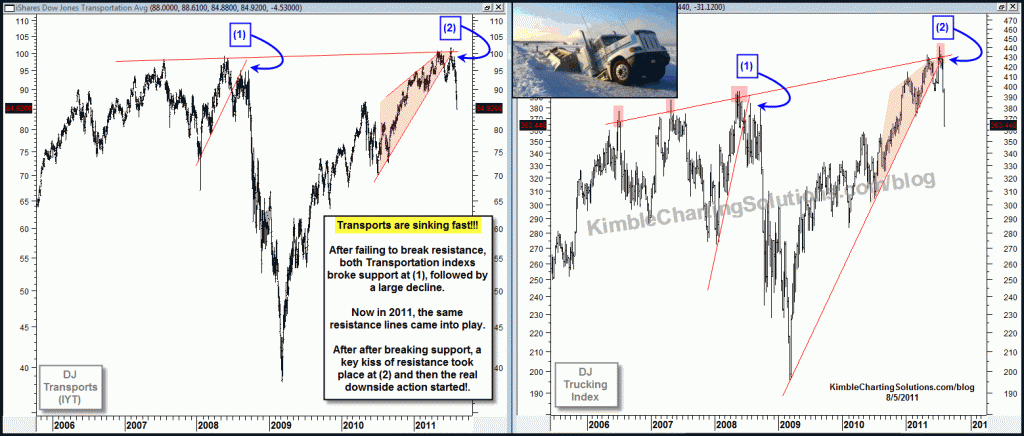
The chart below was posted on 7/28, reflecting that negative patterns in the leading transportation industry was at hand and they were suggesting that gravity can be pretty painful and Ole Wiley was waving good bye to current prices.. (See post here)
IYT and the DJ Trucking index were both suggesting a high level of risk was at hand!
CLICK ON CHART TO ENLARGE
Below is an update to these patterns, reflecting that when a rising wedge is at hand and support fails, the declines can be very large and swift.
CLICK ON CHART TO ENLARGE
Even though the size of the decline might have surprised many investors, this is the type of action that comes from a breakdown of a multi-year rising wedge breakdown.
This same pattern took place in 2008 and the decline did not end for a good while. So even though these indexs are down hard, odds suggest the decline is not over with yet.


John….Great observation and Thanks for sharing!
Chris
$tran has finally started down the trail that KRE and $BKX have been blazing.
The banks started this mess it’s only fair they lead the way once again!
Thanks for the great blog
JohnL