I have received a large number of emails of late asking about upside targets to harvest Gold, since we have been long GLD for a while now.
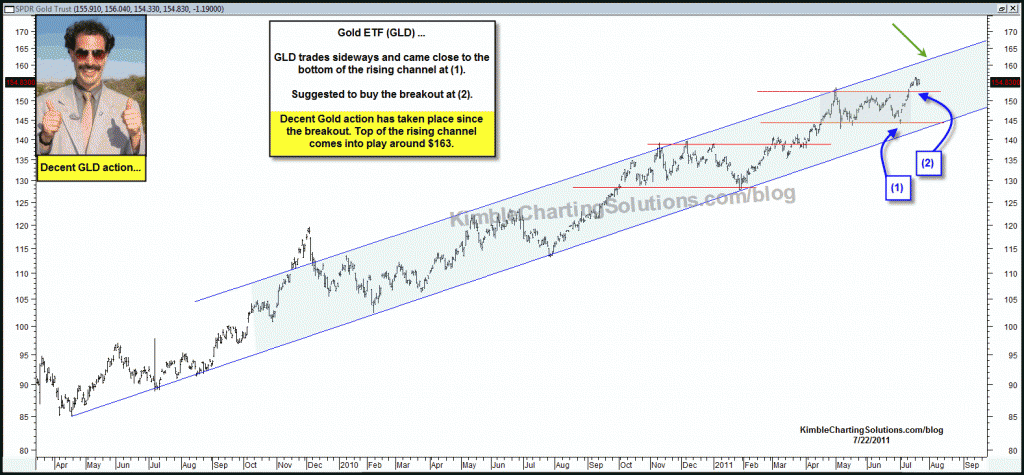
Below is a chart published a couple of weeks ago per the update on the breakout in GLD (see post here) which was a follow up to the initial purchase of GLD from its sideways channel breakout (see post here)
CLICK ON CHART TO ENLARGE
Back to the original question, which was…“what is the upside target for Gold?” Upside targets are difficult to determine for any product for sure, well at least for me they are!!!
One tool that often times comes in handy is the application of “Fibonacci Expansion/Extension” levels.
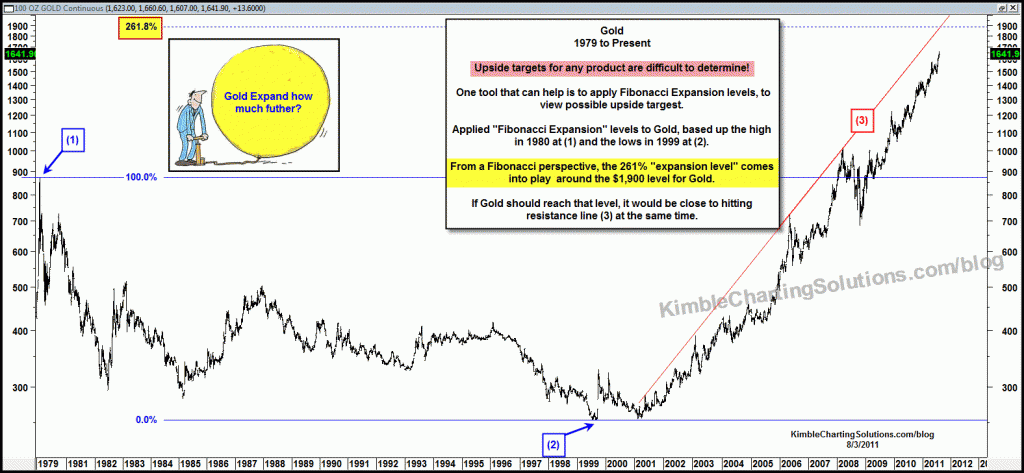
Below is a 30+ year chart of Gold with “Fibonacci Expansion/Extension” level applied, looking for key overhead resistance price points.
CLICK ON CHART TO ENLARGE
As you can see, a key Fibonacci level and channel resistance comes into play around the $1,900 level for Gold.
Does this mean its a slam dunk that Gold makes this level without some backing and filling or a decline? NO!!!
It does mean going forward that if Gold reaches such a key crossroads of resistance at the $1,900 level, some harvesting should be considered. At this time we are remaining long GLD and SLV with a trailing stop just below rising support.


