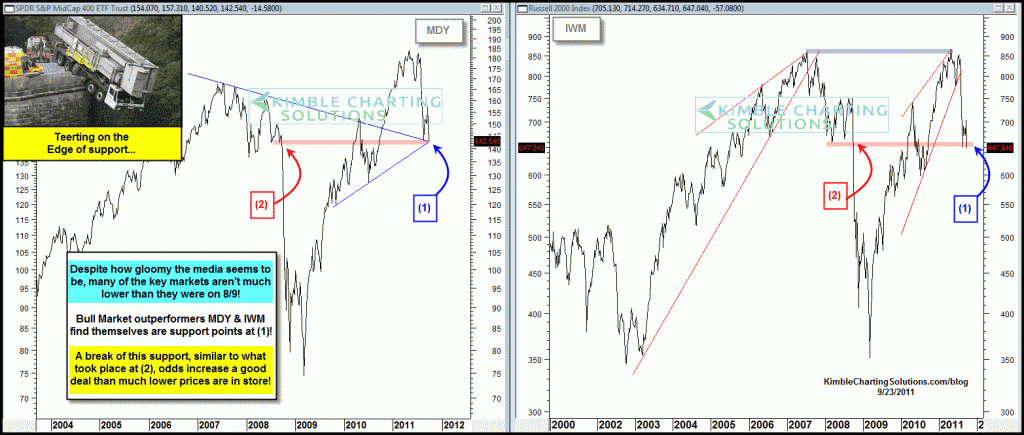
Mid-Cap 400 (MDY) and Russell 2000 (IWM) rallied almost 50% more than the 500 index from 3/2009 to 5/2011, reflecting bull market relative strength. Below, MDY and IWM find themselves setting on the “edge of support!”
CLICK ON CHART TO ENLARGE
Support on these “weekly charts” remains in place! MDY & IWM finds themselves back at the lows of early August. The real downside action in 2008 took place when support broke at (2). If someone has large long positions… I would not want to stick with them very long should support line (2) be taken out!


cjk…YES, if you value daily over weekly charts.
IWM breakdown on a shorter-term daily chart?