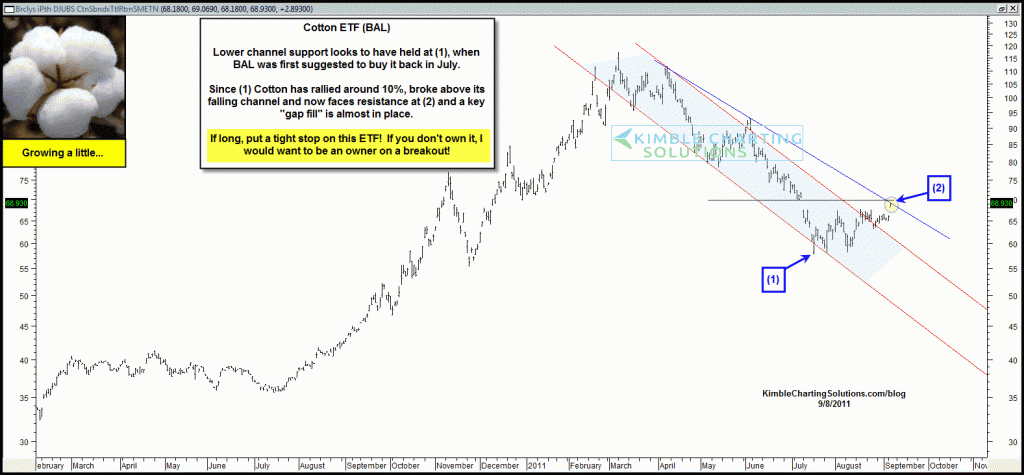
Back in July, Cotton prices had declined over 50% in a matter of a few months and looked like some key support was close at hand in the charts below, post on 7/19 (see post here)
CLICK ON CHART TO ENLARGE
The rally in Cotton off of support has not be spectacular, yet if purchased on support, BAL has moved up around 10%. In the chart below you can see that Cotton ETF (BAL) has broken out of its falling channel, which contained the 50% decline.
CLICK ON CHART TO ENLARGE
After breaking channel resistance, Cotton is now facing a key resistance line at (2). Many of you have emailed me that you own it and wanted an update. As I shared in the chart, if long bring your stop up tight. If you like the looks of this chart and don’t own it, I would be a buyer of a breakout at (2).


