On 9/1 I shared the chart below, reflecting that the Swiss Franc was up against a resistance line that had held each time over the past 30 years and that Gold was at the top of a 10 year rising channel. I also discussed that if the “Power of the Pattern” and history was any guide, both of these assets should decline in price. (see post here)
CLICK ON CHART TO ENLARGE
Why did I chose an image of a man yelling in the phone and saying “No Way?” I suspected their would be a large crowd reading this post and the photo/caption would reflect their opinion/sentiment. Even though 100% of the time over the past 30 years Gold had declined when the Franc hit this line, could it be different this time? Sure anything was possible, yet the patterns reflected a high chance, it “would NOT be different this time around!”
So what has happened in the following 25 days since that post? Both the Swiss Franc and Gold have experienced their largest short-term declines in 30 years. Bloomberg reported that Gold suffered its largest two day decline since 1983 this past Thursday/Friday.
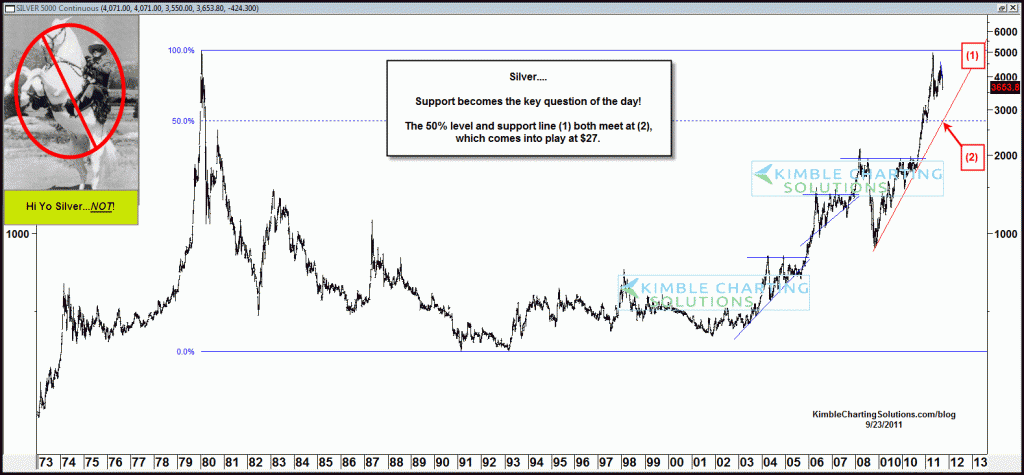
Friday the chart below was suggesting that Silver could still fall further to a key intermediate support line around the $27 and investors that are short Silver would want to look to do some harvesting at this key level.
CLICK ON CHART TO ENLARGE
I have received numerous emails asking where Gold would look to find similar short/intermediate support. For those viewers that are short Gold (owners of GLL) due to this quiz (see shorting Gold quiz here) below is an update on the Gold charts.
CLICK ON CHART TO ENLARGE
Gold should find some intermediate support around the $1,500 level. For those scoring on defense, this would be a good place to look to harvest some of those gains. Keep in mind that GLD become the largest ETF in America last month, which reflected a VERY CROWDED TRAIN! (see post here) With so many people piling into GLD at these key resistance level, selling pressure could be bigger than many suspect!
Gold lost 25% of its value in the GE1 (great escape part 1), a similar decline in GE2 (Great Escape 2) would take it down to $1,425. See why markets are under GE2 pressure (see post here)


Hello Chris,
your call of gold coming down was an excellent one and against most opinions. Congrats.
i am getting more and more convinced on power of patterns.
thanks for showing us proof of the same
also appreciate your knowledge sharing. we get to learn a lot from it
thank you for all your postings
Cheers
Alpha… Support line for Gold I believe in, per this rising channel remains in place. Nothing has happened to break this rising channel! The rising channel 10-year support, in the way I look at it, remains a good deal lower from current prices, so if investors are long, they may have to deal with still lower prices/falling values for a while.
I am not a fan of sitting and taking a 20%+ decline, that is why I did several posts on harvesting or hedging Gold when it was at $1,900.
SPY (a broad based ETF), became the biggest ETF in America years ago and then what happened? It went no where for the majority of a decade! GLD (a sector ETF) is now the biggest ETF in the states. I am not a big fan of crowded trades/trains, when rising wedges/channel resistance and 30-year fibonacci resistance levels come into place.
Great question Alpha, hope this helped a little,
Chris
Dear Chris,
Gold has repeatedly tested the rising trendline that come in play about 10 years ago… if my eyes are aligned…
From a long term perspective do you think it might be a strong support or the Eiffel tower pattern is more strong?
Thanks