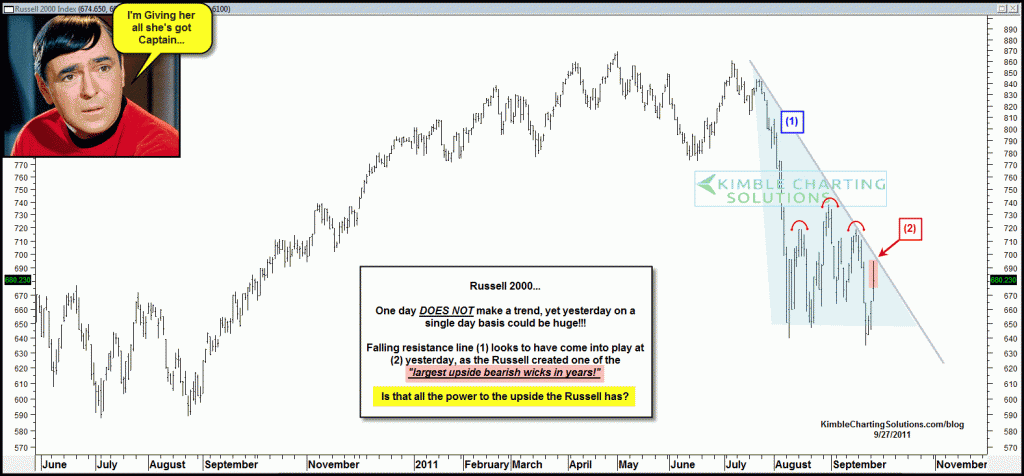
I’m sorry if I am getting a little micro this morning, yet I wanted to highlight an unusual single day pattern in the Russell 2000. At the highs in the markets yesterday I posted the chart below and ask if the “Russell 2000 was going to get hit on the head… again?(see post here)
CLICK ON CHART TO ENLARGE
Let me be clear…one day does not a trend make! Since the markets are in the narrow 8%/Quick draw McGraw channel, I want to share any short-term clues that might be taking shape that could give an edge to the bigger move from the channel!
CLICK ON CHART TO ENLARGE
In time, odds are low a single day pattern will mean much, yet the single day action at (2) sure caught my attention yesterday. Why? The Russell created one of the larger “upside bearish wicks” in years at falling resistance, drawn from a potential right shoulder. For shorter term investors, shorting at resistance on counter trend rallies remains a good idea until proven differently.
The longer a pattern stays in place (sideways channel) the bigger the move will be when resolved! This pattern will end and as always, opportunities will be at hand on the breakout/breakdown.


Very Cool,
Thanks!
Lurking…Please send email to me, with Premium Member info request in the subject line and I will send you info.
Thanks for your viewership,
Chris
Dave…Please send email to me, with Premium Member info request in the subject line and I will send you info.
Thanks for your viewership,
Chris
Tom… A “weekly” close below 650 I feel is key. That was the August low. Great question and Thanks Tom.
Chris
can you explain “Premium Member” please?
Dave
Chris,
How many consecutive days of trading below 650 before you would bet on a major collapse?
Thanks!
Tom
Chris,
What is that email for the Premium membership?
Thanks.
Dave… Thanks- Premium members went short yesterday up against this resistance. So far so good. High/Low/Close creates the same pattern, that is the “wick” I was referring to. Thanks for sharing your target!
Appreciate the comment and viewership,
Chris
check out P&F daily chart on IWM – low pole revesal yesterday – bearish target of 560…
Dave