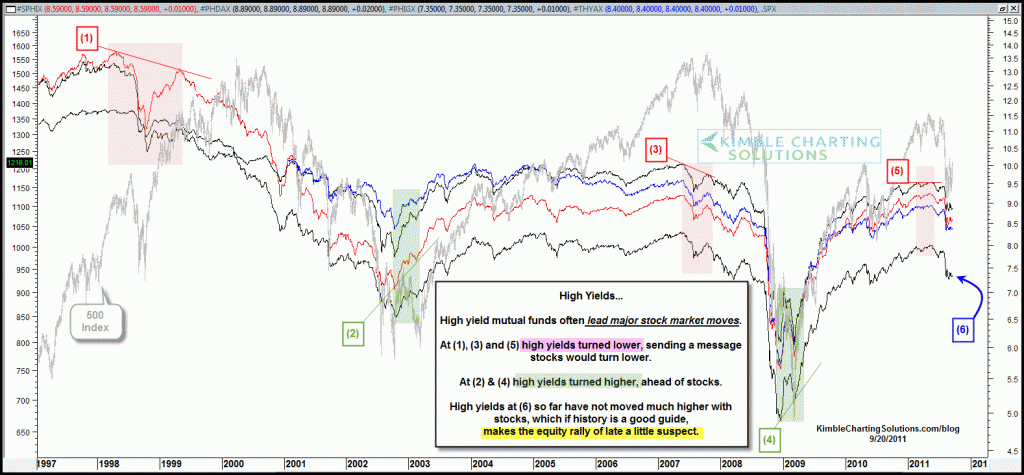
Below is a chart published on 9/20, reflecting that high yields have been a good leading indicator for the stock market, for the past decade plus! (see post here)
CLICK ON CHART TO ENLARGE
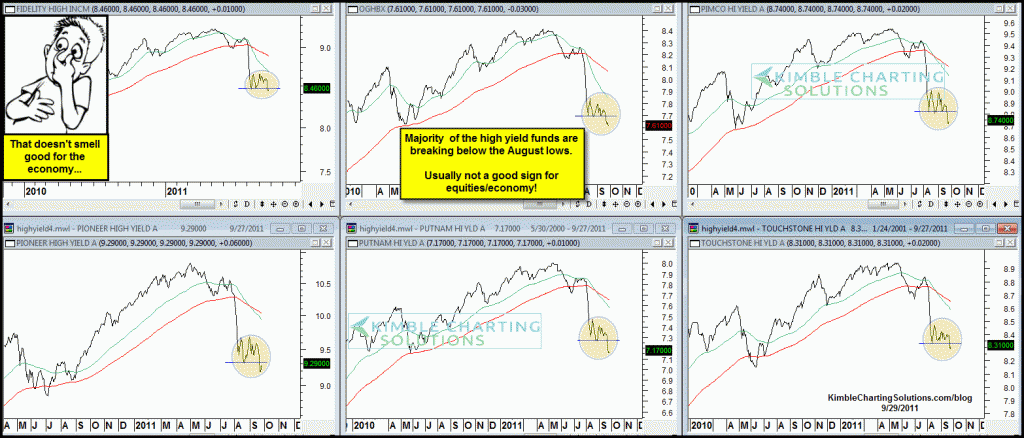
Below is an update on the high yield funds over the past few months, reflecting a new breakdown in prices…
CLICK ON CHART TO ENLARGE
As you can see the majority of the funds are breaking below their early August lows, even though the broad market has not. If history is any guide and the high yields continue to give leading edge signals, this breakdown is not a bullish sign for stocks and the economy.


Alpha…High yields will go back on a buy signal…when at what price is yet to be determined…even after 50% decline in 2003 and 2008, they went back on buy signals. Volumetric analysis…5% of the time, 95% of the time patterns. Flag/pennants only indicate a big direction, I like then to see if more people are selling or buying to get a jump on the huge move. That is what helped me with shorting silver before the big decline.
Chris
Dear Chris,
it is possible that HY does not bounce back to their moving average 200 as resistance level?
For the stock market… you use volumetric analysis to understand the direction of big investors?
Thanks a lot