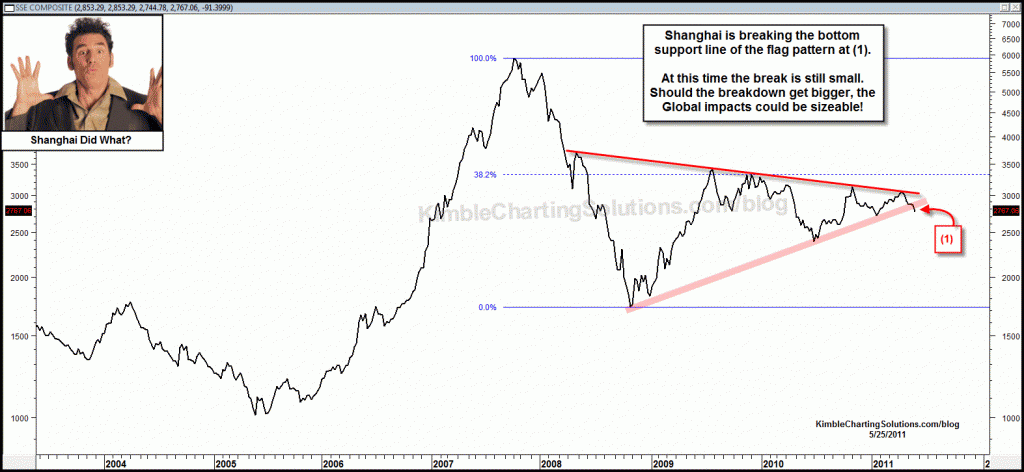
Shared the chart below back in May, reflecting that a multi-year flag/pennant pattern was breaking to the downside in the Shanghai index (see post here) The last line in the 5/25 post was…”the impact could be huge!”
CLICK ON CHART TO ENLARGE
So what has happened since the Shanghai index broke support? A global sell off in stocks and the CRX (Commodities Index) followed! (see CRX breakdown here). In the chart above I shared that the global impact could be sizable and it has been. Is it really all about the news from Europe/Greece? Nope!!! What would have happened to investors portfolios if they had reduced risk exposure at the time of the breakdown? Larger portfolio values and greater peace of mind!!!
Why did I share the Shanghai flag numerous times on the blog? I felt portfolio construction/risk exposure should be geared toward the outcome of the multi-year flag pattern, based upon one of the largest economies in the world!
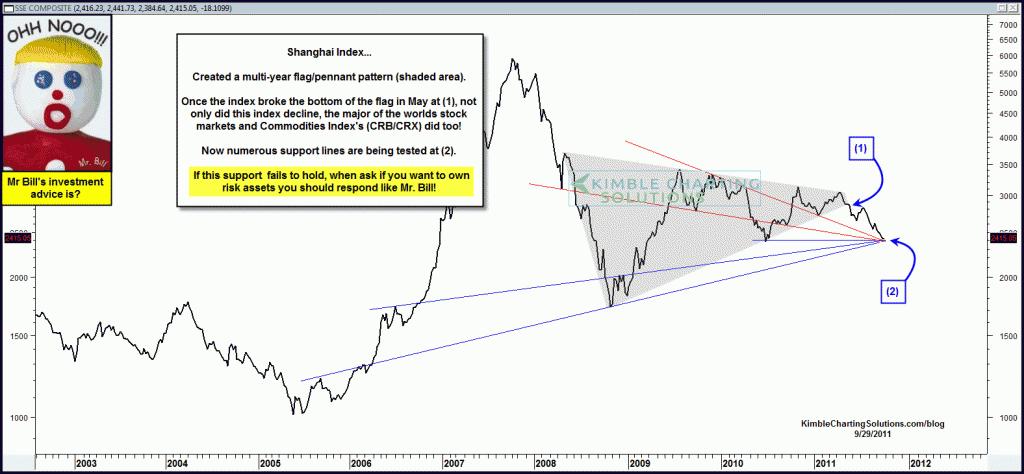
Now another important pattern is taking place in the Shanghai index…
CLICK ON CHART TO ENLARGE
Mr. Bill’s investment advice is spot on…..should support not hold at (2), when ask if investors should have much risk exposure the answer would be….Ohh Nooo!!!
A leading research firm announced this morning, around 5:25 a.m (Central)., that the economy is heading into a recession. (see video of the interview here)
If you have been a viewer of my work over the past few years, you know I am NOT into labels. My goal isn’t to be right about a label, it is to provide research that could help investors “enlarge their portfolios regardless of market direction, by using the Power of the Pattern!”
The Power of the Pattern suggested we could be facing GE2 on May the 5th. (see Great Escape here) For those new to this blog, what is Great Escape all about? In 2008, investors experienced GE1 (Great Escape 1), which was a time when investors said “just get me out of here/Sell the majority of the assets I have/sell even the winners!” There was very few places to hide back then, not even Gold and Silver! How are the metals acting of late in 2011?
Two weeks after the Shanghai Index broke support, the “Power of the Pattern” was suggesting another Great Escape looked to be around the corner, I alerted viewers that the “Shoe Box” indicator was on the verge of sending its first sell signal, suggesting that investors should place risk assets in a shoe box/safe place/reduce risk…this was the first signal to due so since Mid-2007 (see post here).
Are we headed into a recession? I don’t know, its above my pay grade….again I am not into labels! The “Power of the Pattern” is suggesting that should the multiple support lines give way in the Shanghai index, the theme of “looks alikes, Dominoes and Slipper slides” continues! If you didn’t dial back risk exposure months ago, please do so should the Shanghai index break support!
One thing I want to be clear on…”I DO NOT WANT TO BE CORRECT ABOUT ANOTHER GE2 !” I would love nothing more down stream for people to say…”You blew it on that one!” Am I ok with having egg on my face per being wrong on the marco GE2 possibilities? You Bet!!!


Do you think it’s still time to buy AGA? Since you say that in the past grains and meats were the last dominoes to fall…
Hey Mark…Good to hear from you and great question. Premium members were already short the Russell. This was our line in the sand to pick up more inverse positions. Not a very fancy thought you it could be impactful-The Power of the Pattern seems to be suggesting that a breakdown below the early August lows could bring in a new round of selling. Elliott followers could equate this to a “wave 3 kickout/breakdown!”
Chris
Hi, Chris:
I see you wrote on 9/28 that for the Russell 2000, a weekly close below 650 was key. I think the weekly close is now 643. Is this it? Are you shorting with RWM(your favorite short!) or are you still waiting patiently through this ‘Quick-Draw’ period?
Everything else (Shanghai flag, high yields, US dollar) seems to be pointing towards your GE2.
thanks Chris,
Must say the grains are really getting hit today–they are all down big time major weakness for sure –it sure seems to playing out as you have stated
Robert…ok…one of the last straws of strength back in 2008, that held up the longest was the grains and meats….keep a close eye on the grains especially, per if you see weakness. Uncle Fibonacci and rising channel resistance called for a high in gold at $1,900, gold got 1% above it and now is a couple hundred dollars lower….just sharing strategies and repeating patterns no bullish or bearish hope strategies coming from this end
Andrew…..Thanks for the kind words…Great way of putting the Shanghai situation into words Andrew!
love the chart Chris. Having multiple converging trend lines has to give confidence about the strength of the support but also concern about the consequence of a mutli trendline break
do you also see gold going down—Yes it is a commodity but it also is a safe haven and may not act like it did in 2008–Gold is money .
Thanks, Chris. Your are great!
What do you think of silver in short term?