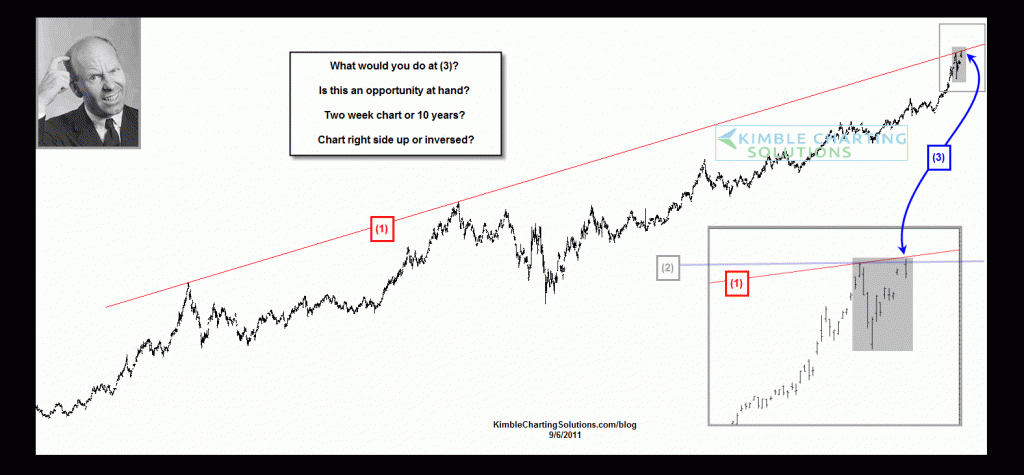
Posted the chart below as Tuesdays quiz. (see post here).
CLICK ON CHART TO ENLARGE
The response from around the world was huge on this one. Thanks to all of the regulars who responded and a big Thanks to all who responded for the very first time! The number of people who knew what the chart was, has never been higher! Just a little warning…look out next quiz! 😉
Below is the answer from Thursday. Since then it has been a wild few days to say the least.
CLICK ON CHART TO ENLARGE
Over a month ago I did a 30-year Fibonacci calculation (when gold stood at $1,641 per ounce) and it reflected that Gold should rally around $300 more, up to the $1,900 level and find some key resistance there. (see post here) Gold hit this level on 8/22 for the first time in its history and then quickly backed off $200 per ounce. Almost as quickly as it declined $200, it rallied back to the $1,900 level in quick order.
The quiz was created two days ago as Gold was hitting this key Fibonacci level for the second time in a few weeks. It would appear that this Fib level is really important, as Gold has become very volatile at $1,900. Is this a “double top” for gold in the chart above? Could be!
Gold remains in a solid rising channel that has been in place for 10 years and is an awesome “trade the range play” per buy at support and harvest at resistance…that is the way we have to look at this right now, per harvest at resistance and look to buy it back at support!
If Gold can punch through this Fib level, the next 30-year Fibonacci level comes into play around the $2,900 level, first discussed in this post of 8/19 (see post here)


Rob…From a 10-year rising channel, which is fairly long-term, the channel looks to still be in place. (see 10-year channel here)
Thanks,
Chris
For longer term trend like here, GLD may not present the right picture. If you look at the actual gold price or GC the trendline has already been broken to the upside?
Chris – take a look at AAPL and GLD on same chart since mar 2009. Surprisingly similar pattern, but i don’t know if it means anything… 2 good bull runs. AAPL as good as gold I guess.
Mickette…Thanks for the comment. Momentum for gold is strong. From a macro reason for it to fall, the only thing I see is if the Great Escape like 2008 picks up speed and the CRB/CRX keep heading south.
Chris
cjk…no matter the product, aggressive investors should always be open not only harvesting at resistance, they should always consider shorting at resistance with a stop just above a breakout. The reason I did the quiz was just for this exact topic…per if very aggressive, right at the time of the quiz looked to be a great place to buy GLL or DZZ. Could a Dollar breakout put downward pressure on Gold? Sure could.
Thanks for the great question Mr C!
Chris
Chris, I think the turning point for gold could have been already reached last tuesday. What was alarming for gold was the fact that the USDX climbed over the support level of 76.75 this morning.
Hi Chris – although one might want to be long gold at the right price, does recent price action in the dollar support shorting gold, at least as a short-term play? cjk
Jim….Thanks…The key to the chart/quiz is more to the harvesting side, than the shorting side. If viewers bought GLD on the breakout post harvesting at the $1,900 level made them some good gains. Gold is in an uptrend/rising 10-year channel. If anything I just hope that people hold onto the gains they have.
The Franc was on a role, it hit resistance, which means investors should harvest. If they did a week ago, they would have avoided a one week decline of 10%. Don’t know if this will happen in the Gold complex. I’m just my boring ole self…harvest at resistance at the least and see what happens.
Thanks Jim for your viewership and comment,
Chris
It is certainly a provocative call shorting gold but you give excellent justification for it. Good luck! HOpe all is well.
Jim