CLICK ON CHART TO ENLARGE
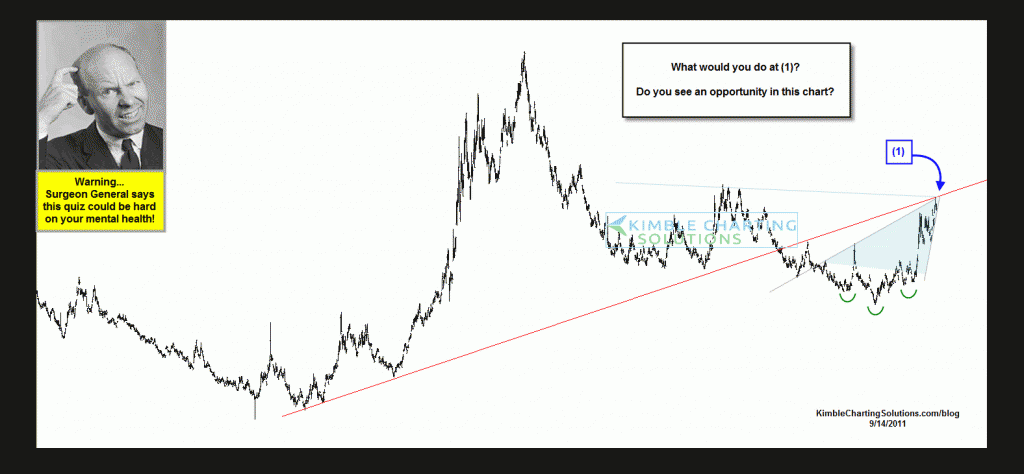
What would you do at (1)? Do you see an opportunity in this chart?
I will post the answer to this quiz on Friday. If you would like to share you opinion/thoughts or would like to know the answer to this quiz, email me at [email protected] (Please, out of respect for others, don’t post the answer on the comment section).
I or my staff will get the answer back to you as soon as we can. Good luck and have fun with this one!


Thomas…Thank you for your viewership and this question. Please email me at [email protected] and in the subject line put…”Premium Membership info request” Myself or my staff will then forward you info on how to become a member.
Hi Chris
How Can i sign up to be a premimum member. Thanks.
/regards Thomas
ML Greg…Thanks for the kind words Greg. Much appreciated at this end. QE2 become very popular, I hope GE2 doesn’t! I kid people I didn’t name my company Kimble Charting “Problems”…its all about solutions! The opportunities have NEVER been greater in the 31 years I have been in this business, due to the tools available to the masses. The potential to “enlarge portfolios regardless of market direction” are outstanding!
Thanks again Greg and keep up your great work too!
Chris
In a world with a lot of acronyms, GE2 is the most clever I have heard in a while! Love the acronym, but don’t necessarily like the potential consequences of it occurring. Thanks for the charts – the pictures – and now the acronyms.
Ty… Thanks for this comment and I agree that Silver is a more pure/accurate tool to look at than SLV. I will post a chart in a couple of days that I sent to Premium Members of SLV, with a study of “On Balance Volume (OBV)” This OBV study reflects a positive trend in OBV for Silver for several months, creating a rising support line….that is the past though…as of yesterday, SLV broke below its rising support line, reflecting that if you lift up the hood and look underneath it, some key selling is coming into place.
Even though SLV isn’t perfect due to the accurate pricing issues you brought up, the flag/pennant pattern remains pretty true to form. The patterns in gold suggest that $1,900 should be key resistance…if that is true and gold backs off, SLV should break below its flag pattern. Flags/pennants as you know are real helpful in direction, they just suggest a big move is ahead. It is due to this situation that I wanted to shared the OBV issue. Also if GE2 (great escape 2) takes place, odds increase investors around the world will head to the exits, in the vast majority of products. I DO NOT want to see GE2 take place! I believe we can win the trading battle very easily if GE2 happens again, yet thw world will lose the financial war, not something I want to see at all!!!
I will post on the blog one of my favorite charts I shared with premium members this past week soon, that raises my concerns that GE2 is getting much closer than I want to see. Keep in mind…I soooo want to be wrong about GE2. I am fine with having eggs and omlets on my face over GE2 story. I would love for viewers to say “Chris you blew it big-time on this one!” We live in great times, per the awesome tools we have available to take advantage of the situation at hand!
All the best, sorry to go on and on,
Chris
Hello Chris,
I have been thinking about your notes about the flag pattern in SLV. I have been trading silver and waiting for a buy opportunity based on the 5 year trend…took it last week. I was a little nervous when I saw your analysis of SLV (which I use) but then I realized that SLV is an imperfect proxy for trading silver as they take out ETF management fees so it is biased to the downside… Anyhow, I would appreciate if you could take a look at the spot silver chart and let us know your thoughts…(Not SLV).Ty