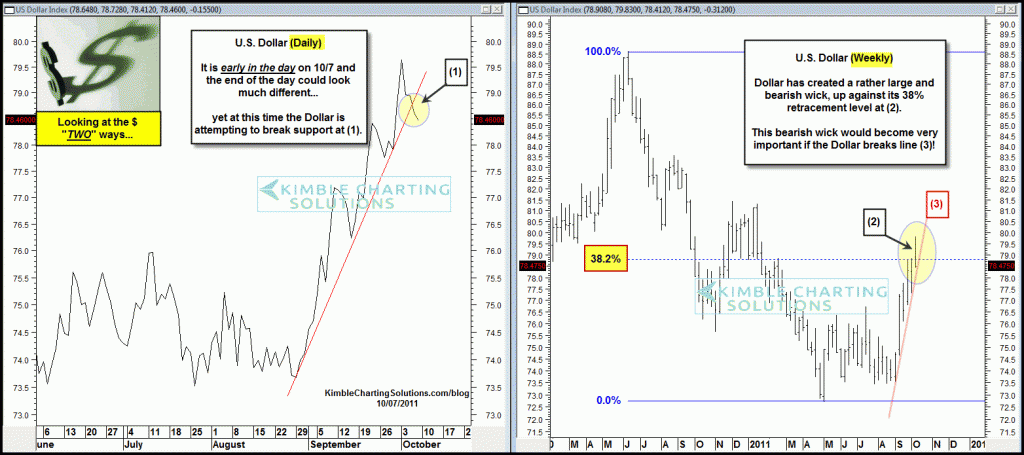
Two weeks ago today, I shared that the Dollar was creating a bearish pattern(s) and breaking support, in the charts below (see post here)
CLICK ON CHART TO ENLARGE
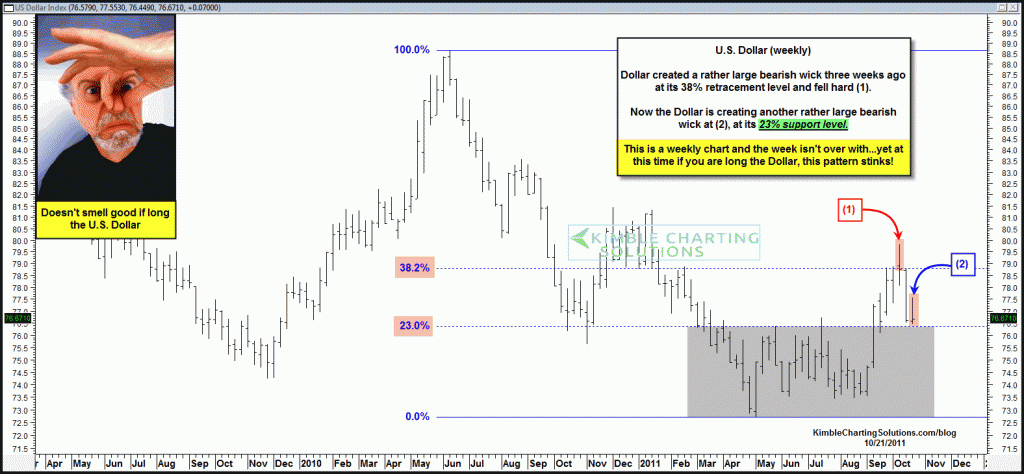
Since 10/7 the Dollar has declined and now looks to be creating another bearish pattern on the weekly chart below…
CLICK ON CHART TO ENLARGE
The week is not over with, yet so far the Dollar looks to be creating its second sizeable bearish wick in 3 weeks! If these wicks happen to be correct and the 23% Fib level does not hold, it could have a rather large impact on the multi-month back and forth trading range ending.
Earlier in the week the Power of the Pattern was reflecting a breakout in PFF (see post here). This is good news from the Preferred Stocks/Credit based arena!


Barcelona… Anything is possible per patterns. I’m having a little trouble seeing it, yet not saying its not there.
Chris
Chris…when I look at this great multi-year chart you generated above something pops out at me. Would you classify the current position of the dollar as the right shoulder on an inverted H&S pattern, too?
Gracias,
Barcelona
Agree with t. reilly that everyone is focused on Europe and the minute by minute “news”. SSEC (Shanghai) closed a few points below the 2010 “critical” low on Friday. Hope it will rebound strongly to the upside on Monday. This has been the weakest equity market, in the biggest Asian economy. Go figure — There are a lot of problems in China, liquidity is very tight, many pay double digit interest. Some pays 2% per month (JNK is a Mickey mouse to the Chinese). Chinese companies are borrowing with banks based in Hong Kong and pay the premium price. The Chinese government is determined to cool the economy, bring down inflation and the bubbly real estate. The water is getting very hot for the little speculative frog. This will have serious impact to commodities and to the global equities. Did I say the Chinese Banks’ balance sheet are weak with many holes? Hope and pray there is no serious hangover to the party goers in N America………..
Chris – after further consideration, I may need to retract my JNK observation (looks like another resistance line is in place as well as the wedge, plus it may have Eiffel Tower syndrome. The jury may still be out on IYM. cjk
Chris, in 2008 the dollar did a violent reversal after its initial breakout to test the downward-sloping breakout line off the Dec (2007), Feb(2008) peaks. The same type of test is very close to taking place today with the dollar testing downward sloping breakout line formed by the mar,may and july (2011) peaks.
In 2008 S&P’s had a violent rally on Sept 19, 2008 that coincided with the dollar’s violent reversal and test. It was an option expiration day and it appeared there was a huge breakout to the upside. Sound familiar….
Come Monday Sept 22, 2008 the crash really picked up speed and the dollar started it’s rapid ascent. Let’s see what happens this time around.
While everyone is focused on Europe, China may be the real problem.
Chris – it appears that JNK is breaking above falling resistance and defied the odds on the shorter-term rising wedge, above which it is also moving – seems to reinforce PFF statement. An then there is IYM looking “bullish”. cjk
dear Chris,
a commodity crash, would be a great positive for corporate margins, consumer sentiment, etc…I think the long term benefits would outweigh any short-term effect by a large margin. What does your pattern analysis indicate in terms of this breakdown target? Thank you again for a fantastic and very insightful blog.
T…The long term patterns of the Dollar and CRX remain in play, yet for sure could break… I WANT the CRX/Dollar play to break. I DO NOT want to see GE2 come true. We could win a trading battle if GE2 comes true, yet the world would lose a huge financial war if it does! I want/desire to have eggs on my face per the GE2 subject.
For members and blog viewers, the GE2 story started 5 months ago. I just wish the world would have understand the downside impact back then, versus now.
On the flip side did anyone notice yesterday how one of the main topics on CNBC was how badly this week copper was doing? If I heard them mention Copper once, they did it a dozen times!!! A good strategy, when they puke a certain subject, look for key technical support/resistance and run the other direction!
Did you hear any of them mention that JJC was looking to have created a double bottom at its 50% support level? I wonder if that was a good time yesterday morning to pick up long copper futures/call options or JJC? YES IT WAS!!! 😉
Bearish weekly, but still getting support from 200MA and 50MA which could be about to cross.
I guess that means your prior post about GE2 and the commodity crash is not likely to come about since that would be a divergence from the repeating pattern. In 2008 the dollar shot higher – this post suggests the dollar is heading lower.