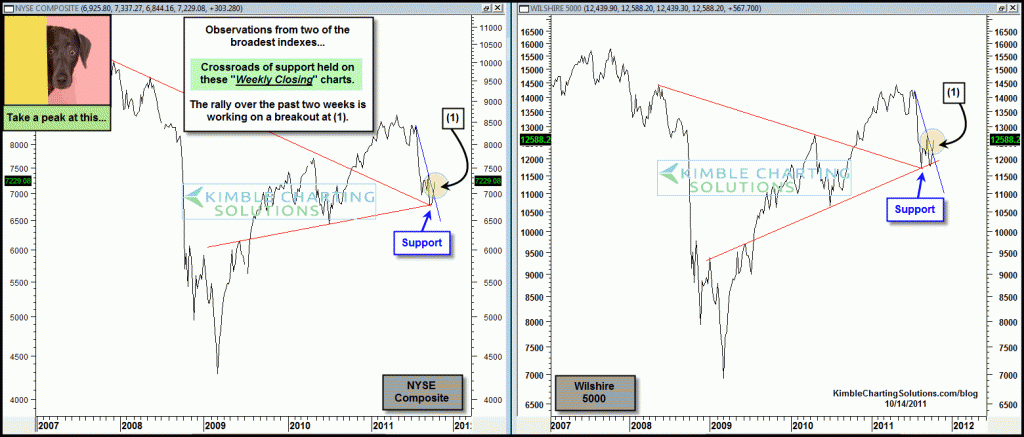
On 10/14 I shared the chart below, reflecting that the broad market was breaking key short-term falling resistance lines, which was bullish. (see post here)
CLICK ON CHART TO ENLARGE
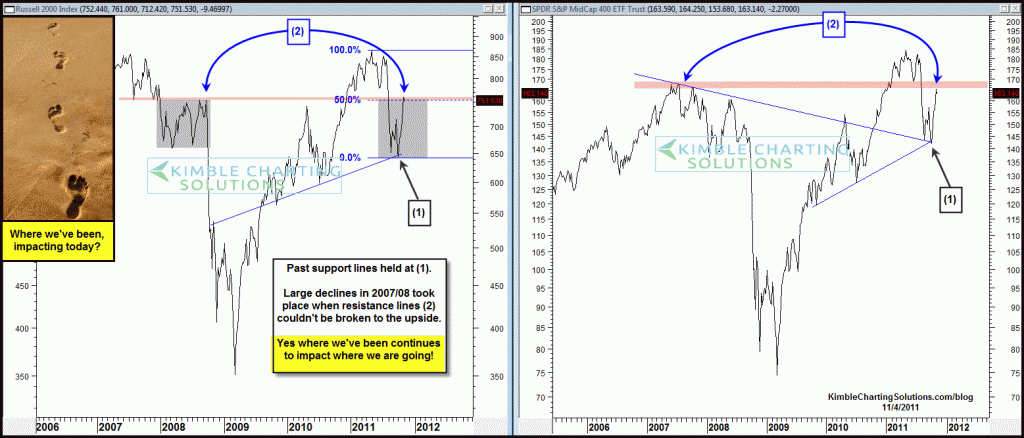
The charts below reflect that bull market upside leaders, Russell 2000 and Mid-Cap 400 are now facing resistance levels that were very important back in 2007/2008.
CLICK ON CHART TO ENLARGE
The rallies since the 10/4 lows are now reaching levels that were very important in our past.
Resistance is resistance until broken!


Marco, a handful of daily sentiment charts, including Rydex bull/bear, is made available by Market Harmonics (http://www.market-harmonics.com/tech_chart_descriptions.htm).
Chris, thanks for your awesome charts!
TLT with it’s present inverse linkage to US Equities, is like holding a short position against Equities, and getting a dividend yield too
hey you have ads now …think we all should click a few
Marco… A few Rydex ratios I have found useful for the past 14 years. The lower chart in this link reflects one of them that I like to use. (see post here)
This ratio is a cash to their funds ratio. Another one I like is the ratio of monies in the bull funds compared to the bear funds.
Chris
please, can you tell us where to get the “Rydex Ratio” indicator?
I googled a bit, but I can’t find it
Thank for your work
B…softer message to short at resistance…we haven’t hit the neckline until now and with the crowded trade being in cash, one of the highest levels since the late 90’s, thats not the time to short until that get worked off and that level was hit 4 weeks ago today. The Rydex ratio has now changed a good deal, I will share it on the blog a few days from now.
C
B…broad market shorts are good idea here as you suggest. I prefer to short higher betas, such a basic materials, yet shorting at resistance remains a good idea.
C
What makes you reluctant to be short against resistance on the broader market here Chris? Your commentary re: short opportunities at resistance points has been much softer/less aggressive in recent weeks…further, what might change that stance?