CLICK ON CHART TO ENLARGE
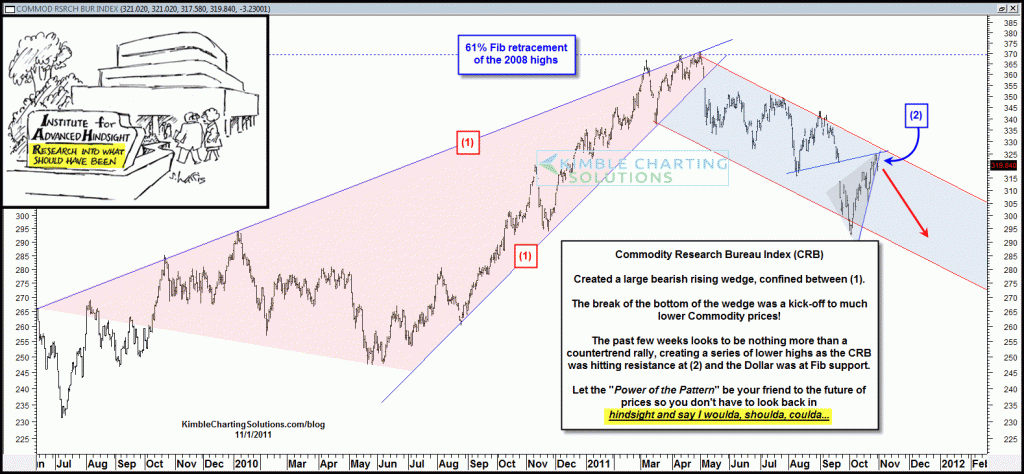
Commodity Index (CRB) continues to create a series of lower highs inside of a multi-month falling channel. The month of October looks to have been a counter trend rally inside of falling channel at (2). This pattern has been suggesting to get out of or reduce Commodity holdings since the break of support back in May. (CRB Quote here)
The above chart is an update to the Commodity wreck post of 10/20 and the chart below (see post here)
CLICK ON CHART TO ENLARGE
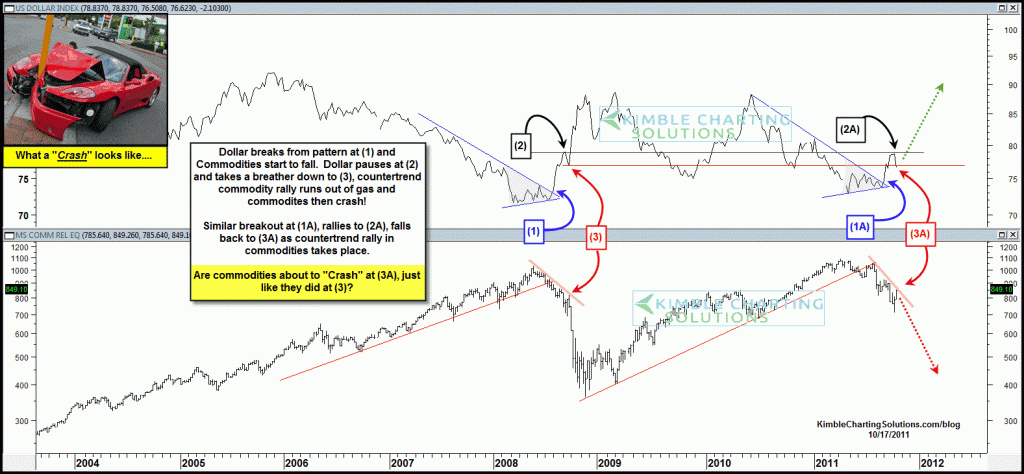
The “Power of the Pattern” continues to suggest that portfolio construction/risk allocation should be based upon the above chart, first shared on 10/17 on dshort.com (see post here) and on the Reformed Broker (see post here) See how the CRX is doing today… (CRX Quote)
The above chart reflects that a breakout in the U.S. Dollar and a breakdown in the CRX index took place in 2008 and these patterns look to be much the same again. Patterns, which represent human behaviors can repeat.
Let the patterns be your friend and don’t become a member of the “Institute for Advanced Hindsight!”


Nov 12, 2011
The commodity up and down does not provide anything but opportunity. Providing you are a
true commodity investor for the long run, the downturn is welcomed. True recovery never
happens without commodities making a big move. The ultimate inflation of 2013-2020 will
make the true commodity investor a very happy individual. Buy low and accumulate silver, copper,
uranium, rare metals, and of course gold. Oh yes, you must be patient, true to your faith in
repeat cycles, and old enough to have gone through the 80’s.
RB
Mr. D….I prefer the CRX over the CRB. CRB is overweights toward crude oil. Both commodities indexs peaked in May and are down since. At the top of the wedges in both was a time to harvest.
C
Hi Chris. The $CRX and the $CRB seem to be telling different stories. Care to comment? And why use the $CRX in the chart above?
Good Evening Chris, Thanks for sharing this chart!
I’ve been stalking the steel industry for an upcoming trade due to a wave 2 count in both SLX and X! I will be sure to stay on my toe’s if I decide to enter the trade!
Your charting skills are insane. I cant figure out how you can see this stuff!