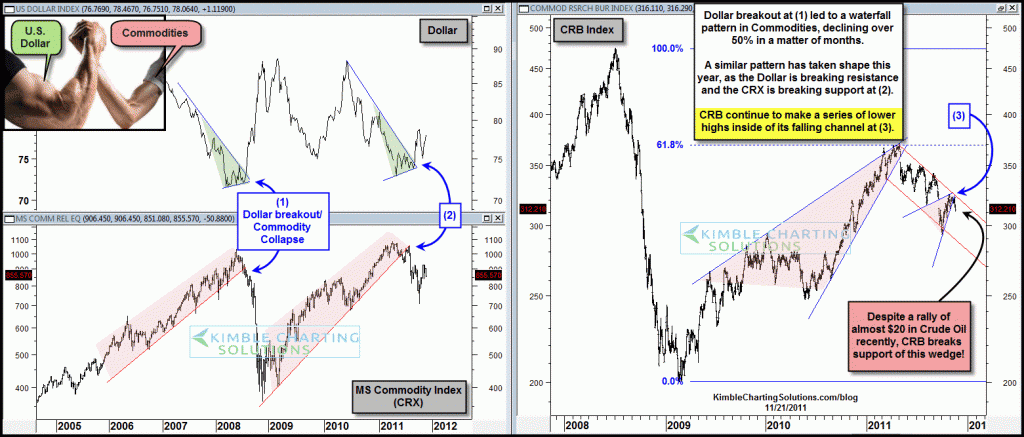
On 10/18 the chart below reflected that in 2008 a Dollar breakout and aCRX (Commodity) breakdown led to a 50% decline in commodities in a matter of months and the patterns of late look almost identical to the 2008 patterns! (see post here)
CLICK ON CHART TO ENLARGE
Below is an update to the above chart with the addition of the CRB index…
CLICK ON CHART TO ENLARGE
The patterns in 2011 remain very similar to the patterns in 2008!
I am surprised that the recent rally in Crude Oil, from the lower 80’s to $100, wasn’t able to push the CRB above its falling channel, which reflects continued weakness in other commodities. Great Escape 1 took place in 2008 and the potential for a GE2 (Great Escape 2) continues to be a possible outcome.
The break of support in the CRB and CRX back in May, suggested that investors should pull back on the exposure to risk assets. Until the CRB and CRX can break above falling resistance lines, this repeating pattern continues to suggest that from a portfolio construction angle, risk assets will be challenged going forward.


Chris,
Although dollar momentum has been strong to the upside, do you see dollar risk (risk asset gain) as defined by Jeff Clark analysis today (below)? Both of you see strong inverse patterns in dollar/risk asset relationship. Just wondering your thoughts on this rising wedge pattern he points out.
“The greenback is tracing out a “bearish rising-wedge” pattern similar to what we saw in August and September – just before the dollar collapsed 6% in one month.
For most of this year, the dollar has traded opposite of everything else. When the dollar rallies, everything else falls. When the dollar falls, everything else rallies. A falling dollar has been bullish for the stock market. In fact, when the dollar broke to the downside of its rising-wedge pattern in early October, the S&P 500 exploded 16% higher in just four weeks.
There’s still room inside the current “rising-wedge” pattern for the dollar to push higher one more time. But after that, the rally is over. If the dollar falls like it did in October, the rally in the stock market should be sudden and severe.
Of course, it’s hard to go from bearish to bullish after only one week. But the circumstances are changing fast. Good traders need to change direction just as quickly. The bearish pattern I showed you last Thursday took only two trading days to play out to the downside. Now it’s time to look for other clues to the market’s future direction.
Beginning with the dollar, those clues are starting to point to a rally.”
Thanks again for the insight – I have learned SO MUCH from your analysis approach.
Ed